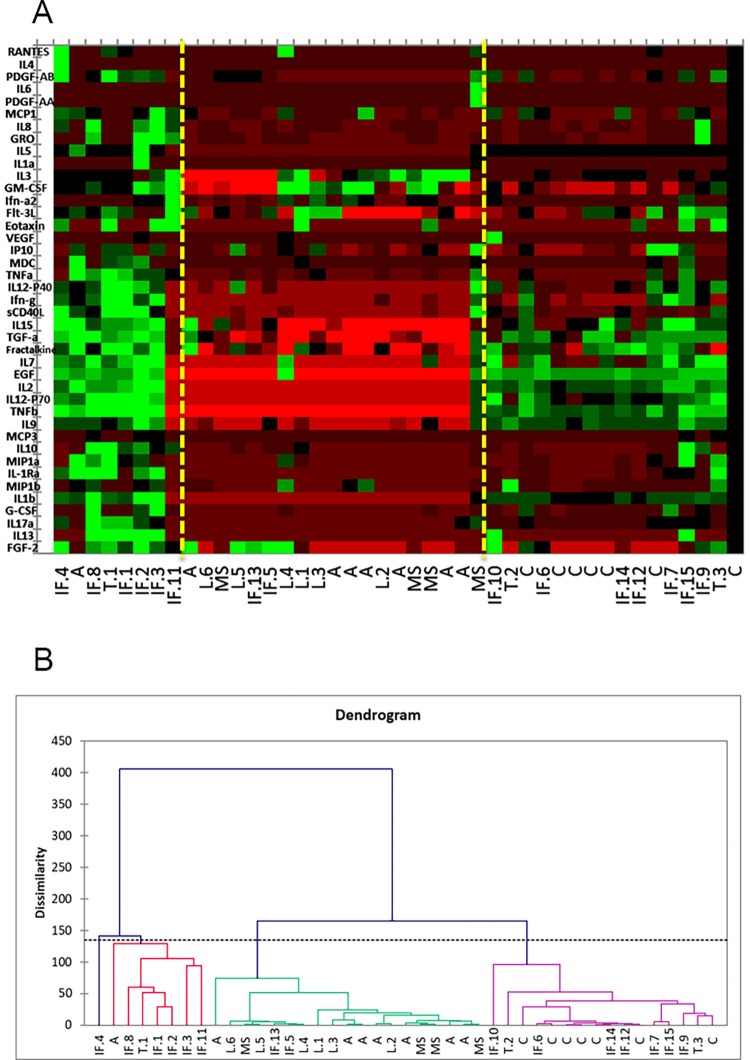
Fig 1. Heat map and dendrogram based on agglomerative hierarchical clustering (AHC).
(A) The heat map visually depicts the cytokine levels using colors (red = low, green = high) shown on the right. The heat map was created in conjunction with agglomerative hierarchical clustering (AHC). The three classes shown in the AHC are reflected here. Vertical, yellow lines have been drawn to aid in this separation of classes. C = control; L = CNS B-cell lymphoma; IF = infection, T = tumor (high grade gliomas), A = autoimmune; MS = multiple sclerosis. (B) The AHC based dendrogram includes all 43 cases and shows separation of CNS diseases into three major classes demonstrating a trend toward clustering of disease types based on overall cytokine profiles. See supplementary table (S5 Table) for a key to the abbreviations of the disease type/class used in the heat map and dendrogram.

