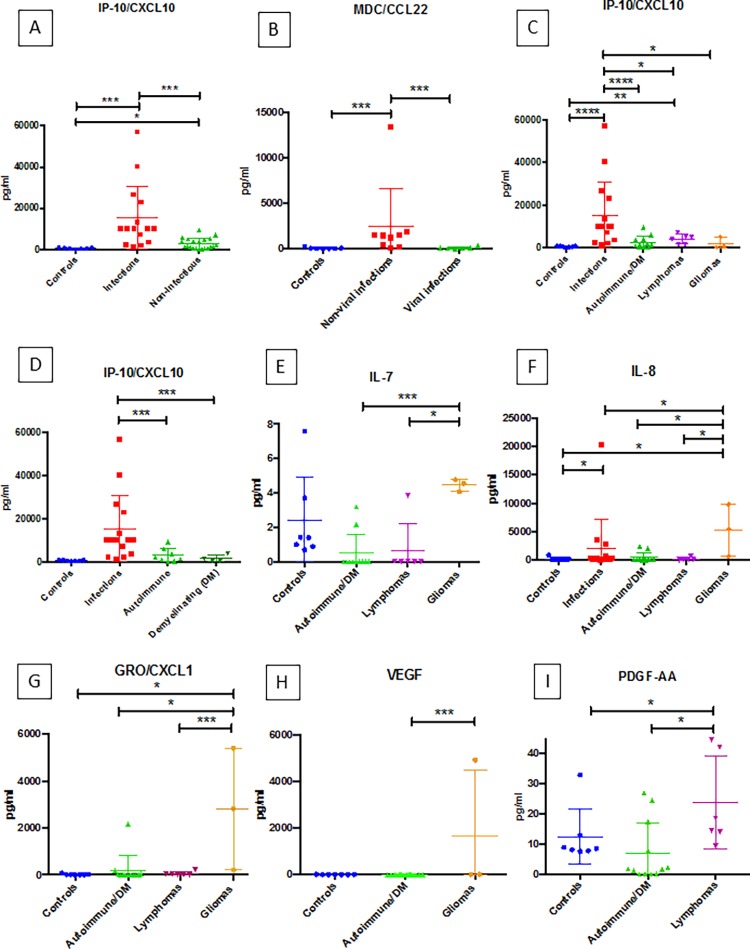
Fig 3.
(A-I): Results from mann-whitney analyses for specific cytokines (IP-10/CXCL10, MDC/CCL22, IL-7, IL-8, GRO/CXCL1, VEGF, and PDGF-AA). Each graph shows the cytokine level distribution for the respective disease groups. In each graph, horizontal lines with an asterisk (*) indicate the presence of statistically significant differences between groups for the given cytokine. The number of asterisks corresponds to the calculated p-value (* = p < 0.05, ** = p < 0.01, *** = p < 0.005, **** = p < 0.001).

