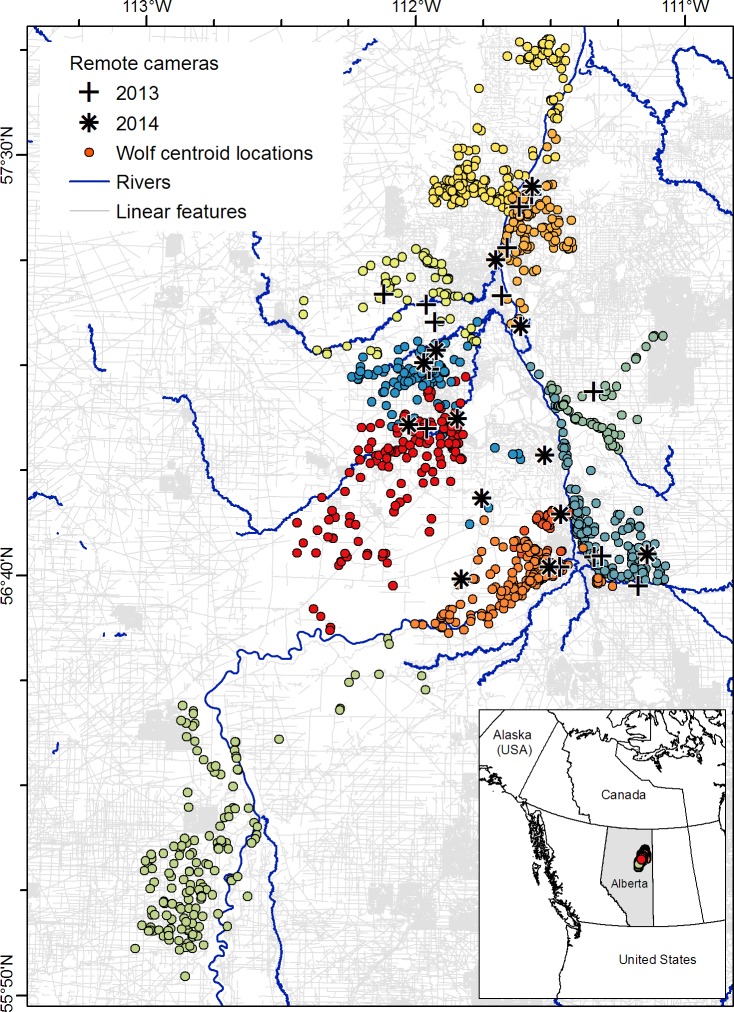
Fig 1. Map of our study area in northeastern Alberta, Canada, near the town of Fort McMurray.
From January to March 2013 and 2014, remote cameras were deployed to identify snowfall events, and 17 grey wolves were equipped with GPS telemetry collars. Location fixes were acquired every 10 or 30 minutes and are summarized here as daily centroid locations. Each color represents a wolf pack (n = 9, plus one lone wolf). Major rivers are shown in dark blue, while linear features (mostly seismic lines for oil and gas exploration) are in grey. GIS layers are available from the following sources: linear features from the Alberta Biodiversity Monitoring Institute’s Wall-to-Wall Human Footprint Inventory (http://abmi.ca/home/data-analytics/da-top/da-product-overview/GIS-Land-Surface/HF-inventory.html), rivers from Alberta Environment and Parks (https://maps.alberta.ca/genesis/rest/services/Base_Water_Feature/Latest/MapServer), and outlines of Canadian provinces and international boundaries from Natural Earth (https://www.naturalearthdata.com/downloads/10m-cultural-vectors/). Modified and reprinted from A. Droghini and S. Boutin, “Snow conditions influence grey wolf (Canis lupus) travel paths: the effect of human-created linear features” Canadian Journal of Zoology 96(1):41. Original copyright 2018. doi: 10.1139/cjz-2017-0041.

