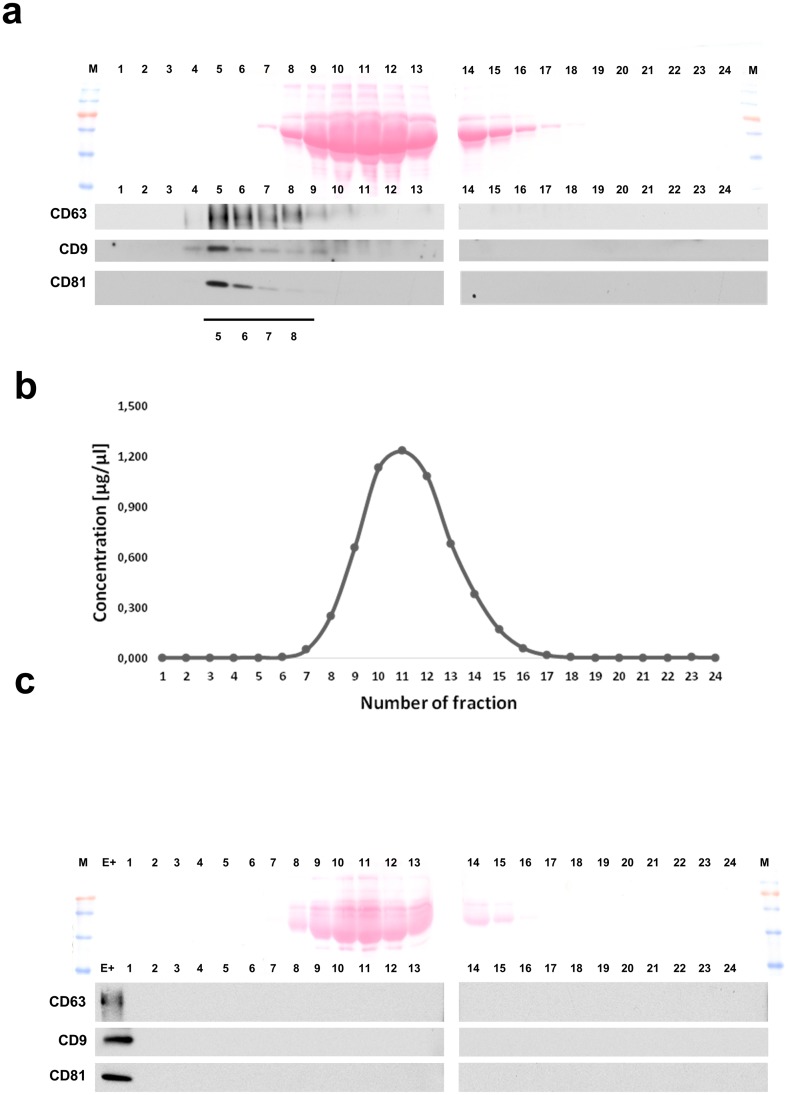
Fig 3. Exosome isolation by the size exclusion chromatography.
In (a) representative immunoblot showing the distribution of exosome markers (CD63, CD9, CD81) and high-abundance serum proteins (illustrated by Ponceau S staining) in the successive SEC fractions of a FaDU culture medium. In (b) total protein concentrations (μg/uL) in the subsequent SEC fractions. In (c) culture medium supplemented with 5% ED FBS and NOT co-cultured with cells was analyzed as in Panel A; “E+” denotes exosome-containing positive control.

