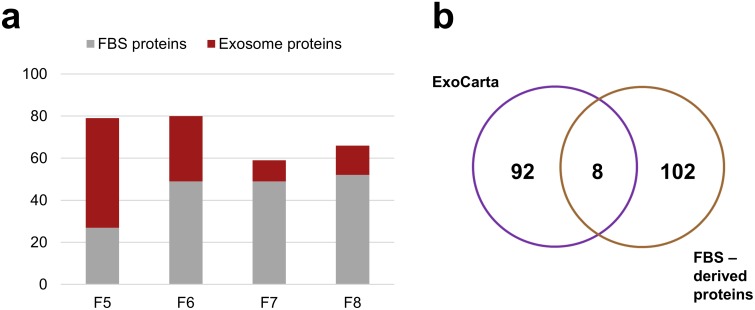
Fig 4. Mass spectrometry analysis of the selected SEC fractions # 5–8.
In (a) the number of proteins identified by MS in each SEC fraction; the ratios of putative exosome specific (red) and FBS serum-derived proteins (gray) in each fraction are shown. In (b) the overlap between the top hundred exosomal proteins reported in the ExoCarta database and proteins detected in the “fresh” culture medium supplemented with ED FBS (SEC fractions # 5–8).

