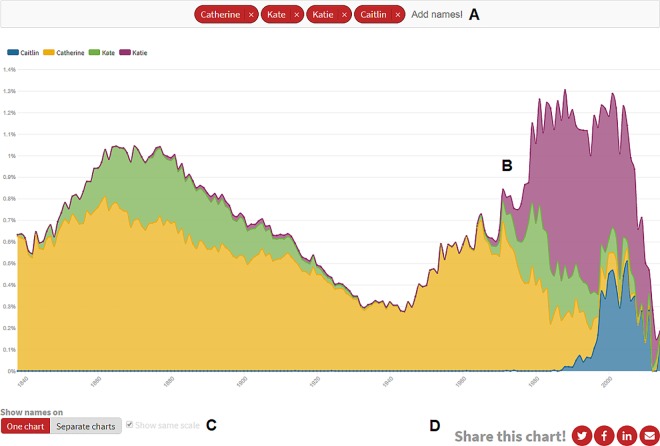
Fig 1. Web interface for visualising forename usage data.
Forename usage profiles in the BMD dataset (S8 Table) are available to search online at http://demos.flourish.studio/namehistory. Names can be entered into a search box (A) to create line graphs (B). These graphs automatically update based on the number of names added to the search box, with data shown either on one chart or as separate charts, which in the latter case can be constrained to the same scale (C). Charts may be shared via numerous online platforms (D). Interface designed using Flourish data visualisation tools (http://flourish.studio).

