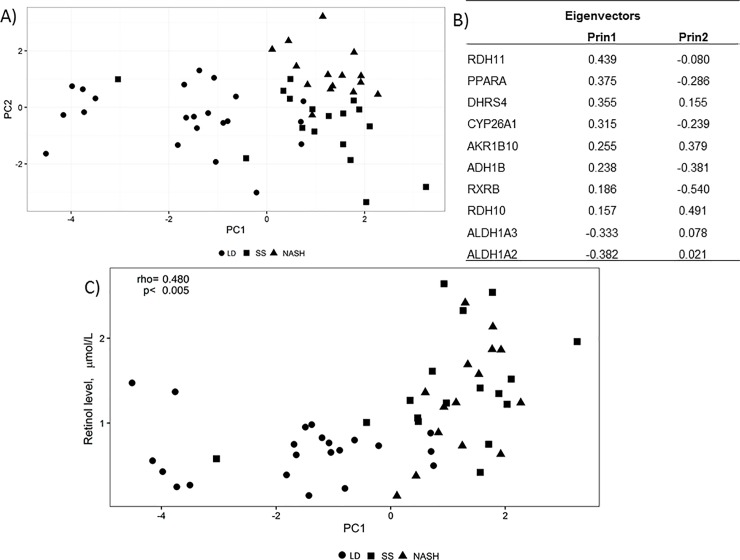
Fig 4. Principal component analysis including 10 genes related to retinol metabolism that were differentially expressed between patients with simple steatosis or non-alcoholic steatohepatitis and liver donors.
(LD, closed circle; SS, closed square; NASH, closed triangle). Panel A shows the first two principal components extracted (PC1 and PC2). The location of each patient in the graph (PC1 versus PC2) separates patients with NAFLD (SS and NASH) from the LD group. This means that NAFLD patients have a distinct gene expression profile for retinol metabolism related genes compared to LD. In Panel B, eigenvectors are presented for PC1 and PC2. The 10 selected genes contributed similarly to PC1, except RXRB andRDH10 that had slightly lower eigenvector values. For PC2, RXRB, RDH10, ADH1B and AKR1B10 had the highest eigenvalues. Panel C shows the Spearman correlation between PC1 (separating NAFLD and LD) and retinol levels for all three groups combined. The analysis was repeated separately for patients and controls. In this case the correlation was only significant for NAFLD (rho = 0.480, p = 0.005) but not for LD.

