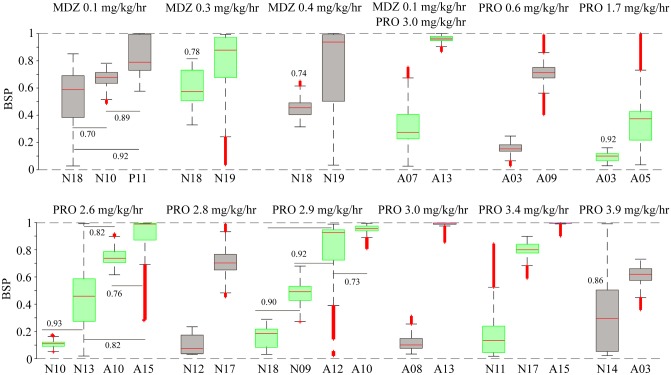
Fig 3. Comparison of BSP values obtained for similar combinations of IVADs given to different patients.
We identified twelve groups of patients, who received infusions at the same weight-normalized rates, and compared the distribution of BSPs achieved in patients within each group. Numbers associated with the boxplots indicate the probability of a sample from the distribution with the lower median is smaller than a sample from the distribution with the higher median. Horizontal lines are used to indicate which pairs are being compared for sets with data from more than two patients. Unlabeled pairs within sets are different with probability one. The infusion rates for each patient group were as follows: Patients belonging to groups 1 to 3 received midazolam infusion only at 0.1, 0.3 and 0.4 mg/kg/hr respectively. Patients belonging to group 4 received both midazolam (0.1 mg/kg/hr) and propofol (3.0 mg/kg/hr). Finally, patients belonging to group 5–12 received propofol infusion only at 0.6, 1.7, 2.6, 2.8, 2.9 and 3.0 mg/kg/hr, respectively.

