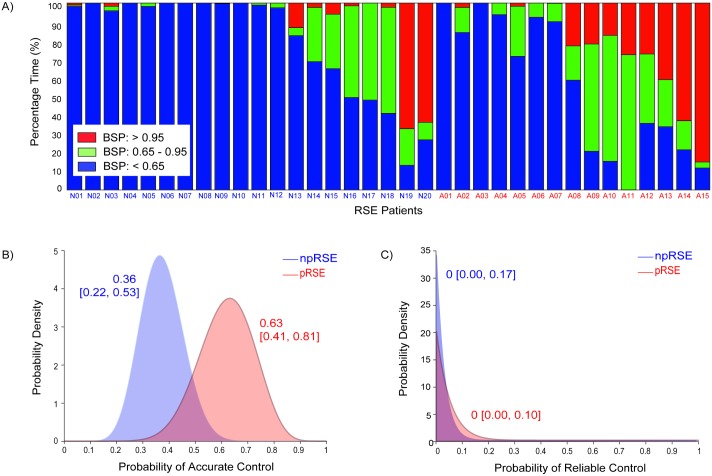
Fig 4. Measures of level of burst suppression achieved.
a) Percentage of time spent within and outside of the reference BSP range in individual patients. Indices representing nRSE patients start with ‘N’ and indices representing aRSE start with ‘A’. Ideally, all patients should be on target (green) for 100% of time. Yet in many patients, the measured BSPs fall below the reference range (blue), and in some cases the measured BSPs overshoot the reference range (red). b—c) Posterior probability distributions for the probabilities that BSPs achieved was accurate and reliable in the nRSE and aRSE patient groups. The numbers associated with each distribution are the maximum a posteriori estimate and 95% Bayesian credibility intervals of the distributions.

