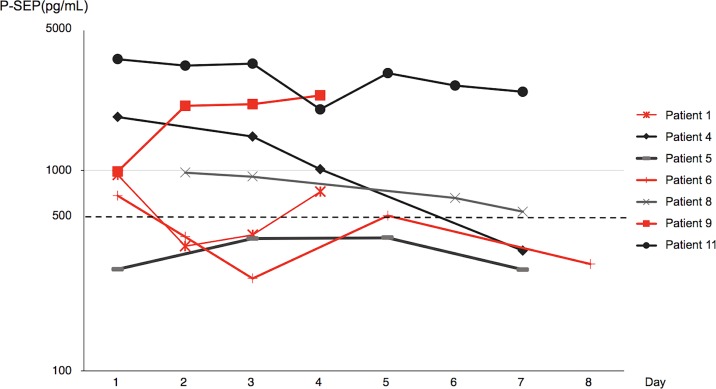
Fig 2. Changes in the presepsin levels in the first week of fungal bloodstream infection.
The P-SEP levels increased or increased again after an initial drop in patients who had poor improvement (red lines). In patient #1, the P-SEP levels decreased on day 2 but increased again with bacterial infection on days 3 and 4. In patient #6, P-SEP levels decreased on days 2 and 3, increased again during a catheter-related bloodstream infection on day 5, and returned to normal after removal of the catheter on day 7. Patient #9 died of fungemia on day 4 and had continuous increment in P-SEP levels.

