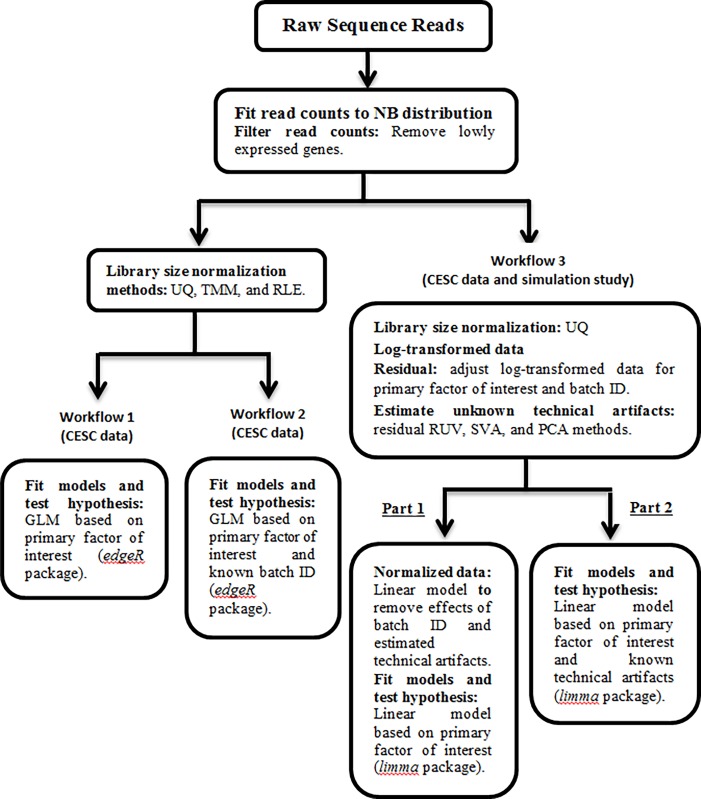
Fig 1. Flow chart showing analysis plan for comparing the effects of different types of normalization methods on differential expression analysis.
Using CESC dataset to compare the effect of library size normalization methods on the differential expression analysis using workflow 1 (design matrix contains primary factor of interest) and workflow 2 (design matrix contains batch ID along with the primary factor of interest). Workflow 3 compares the different methods to estimate the latent artifacts followed by across sample normalization for these unknown factors, and considers the impact of not accounting for loss of degrees of freedom due to normalization for differential expression analysis using both CESC dataset and simulated data. For both simulated and CESC data, we considered two approaches to determine DE genes (i.e., workflow 3): (Part 1) analysis based on post-normalization, and (Part 2) normalization for batch effects is completed through the design matrix that also includes the primary variable of interest. Note that under the workflow 3, the UQ normalization method was not considered for the simulated data, and also there is not any known technical artifact (e.g., batch ID).

