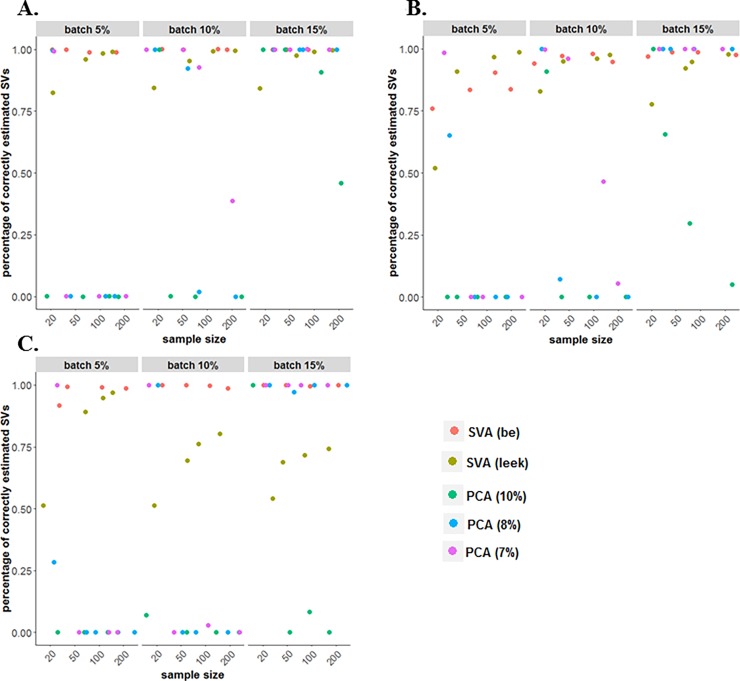
Fig 5. Percentage of simulated datasets with the correct number of SVs detected, were significant SVs were determined using SVA (“BE” and “Leek”) and PCA (7%, 8% and 10% percent of variation).
Simulation with (A) binary (two-group) batch effect, (B) continuous batch effect, (C) a two-group batch effect and continuous batch effect.

