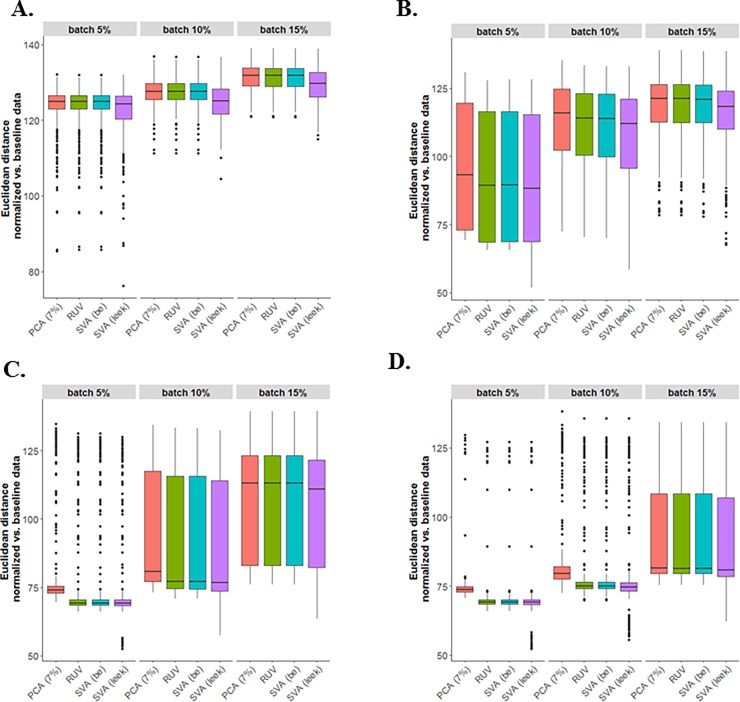
Fig 6. The performance of different across latent factor identification methods followed by sample normalization (SVA “BE”, SVA “Leek”, PCA-7% variation, and residual RUV) were compared.
Euclidean distance between normalized and baseline data based on simulated data with both two-group and continuous batches: (A) N = 20, (B) N = 50, (C) N = 100, (D) N = 200.

