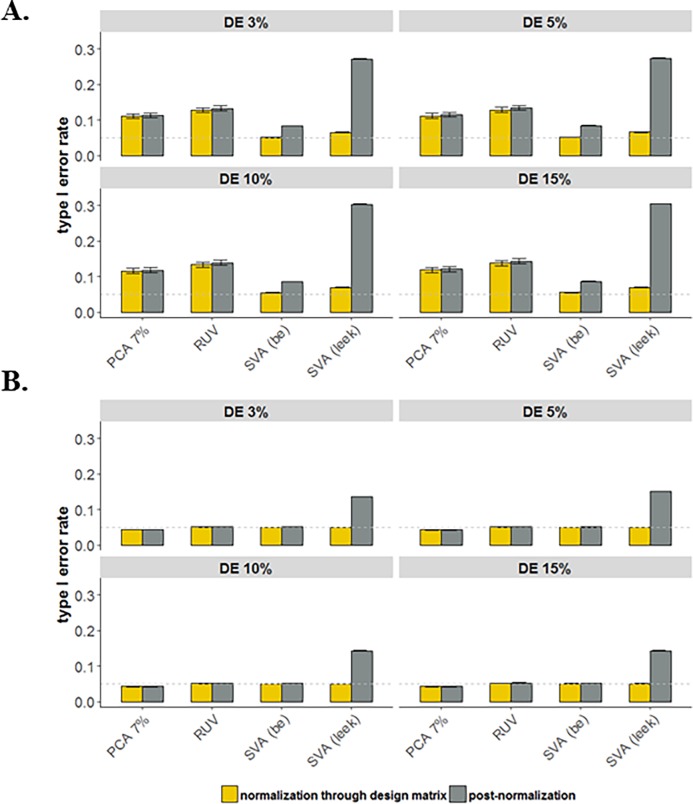
Fig 7. Assess the impact on association analysis the lack of correctly accounting for the loss of degrees of freedom due to across sample normalization methods, SVA (“BE” and “Leek”), residual RUV, and PCA (7% of variation); for simulated data with varying proportion of DE genes (3–15%) and taking into account both binary and continuous batches.
Average empirical type I error rates over 1,000 simulated data sets: (A) N = 50 and (B) N = 200. The horizontal dashed line shows the threshold 0.05.

