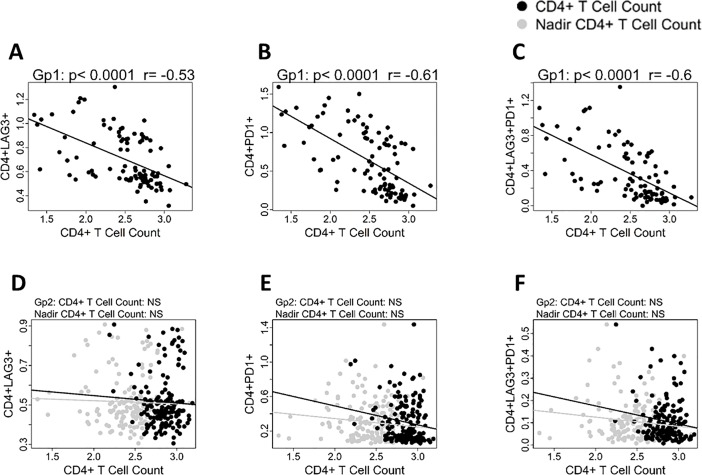
Fig 2. Absolute CD4 numbers correlate with CPI molecule expression on CD4 T cells in ART naïve individuals.
A-C: ART naïve Gp1 patients. Linear regression analysis shows correlation between CD4 T cell counts at study entry with A), LAG-3+CD4; B), PD1+CD4 and C), LAG-3+PD1+ CD4 T cells. D-F: Virologically suppressed Gp2 patients. Linear regression analysis shows correlation between CD4 T cells count (black circles) and nadir CD4 T cells (grey circles) with D), LAG-3+CD4; E), PD1+CD4 and F), LAG-3+ PD1+ CD4 T cells. Pearson correlation was performed based on data distribution; a p value of <0.05 was considered as significant.

