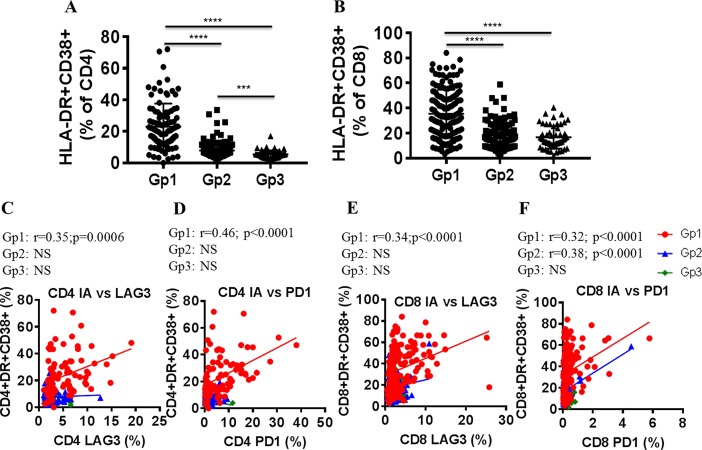
Fig 3. LAG-3 and PD1 expression on CD4 and CD8 T cells correlate with T cell immune activation in ART naïve groups.
Immune activation on CD4 and CD8 T cells was measured based on the co-expression of HLA-DR and CD38 by flow cytometry. Frequencies of HLA-DR+CD38+ expressing A), CD4 and B), CD8 T cells are shown. Linear regression analysis shows correlation between CD4 T cell immune activation with C), LAG-3+ and D), PD1+ CD4 T cells and of CD8 T cell immune activation with E), LAG-3+ and F), PD1+ CD8 T cells in ART naïve (Gp1, red circles), virologically suppressed (Gp2, blue circles) and healthy control (Gp3, green circles) groups. Pearson correlation was performed based on data distribution; a p value of <0.05 was considered as significant.

