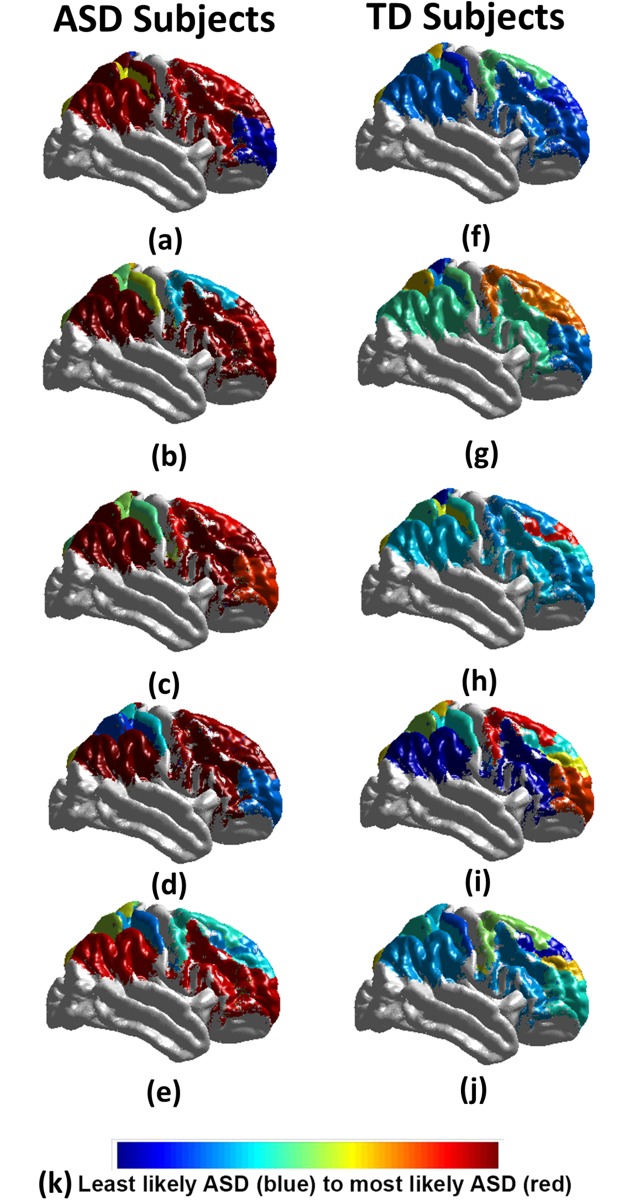
Fig 6. The personalized results of 10 autistic subjects (a-e), 10 healthy controls (f-j); (k) represents the color code used, where blue is the least belonging to autistic class, and red is the most belonging to the autistic class.
It is obvious that autistic subjects have more impacted areas than the healthy controls.

