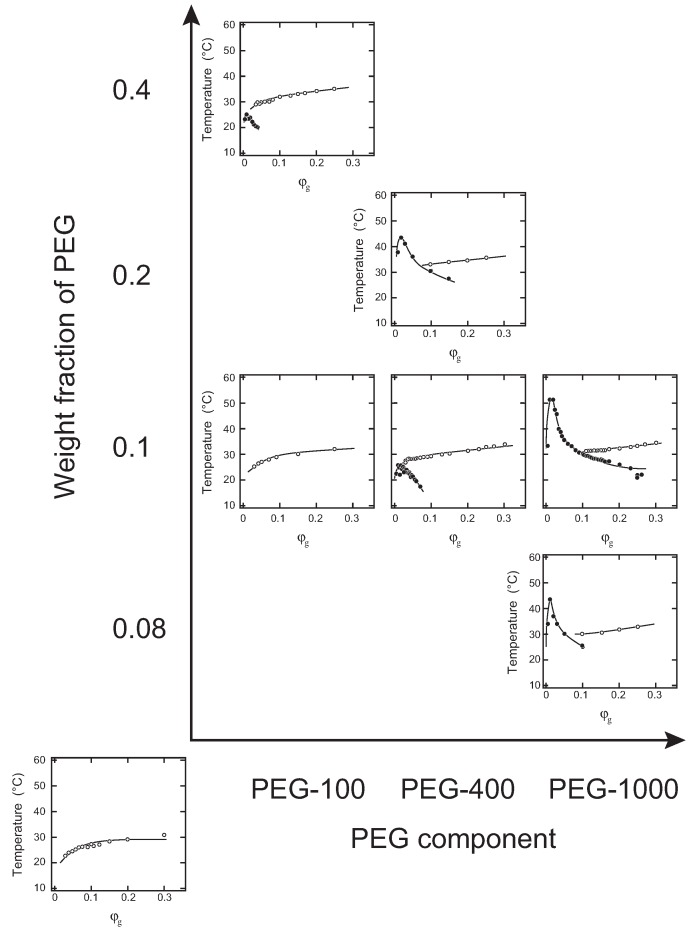
Figure 1.
The phase diagrams of systems with respect to gelatin, water and oligomers of poly(ethylene glycol) (PEG). The cloud point (closed circles) and the gelation temperature (open circles) are plotted as a function of the weight fraction of gelatin, . Each phase diagram is aligned as a function of the weight fraction of PEG and the molecular weight of PEG. The phase diagram of the aqueous gelatin solution is shown in the bottom left corner. The series of phase diagrams at a weight fraction of 0.1 is a reproduction from a previous report [12]. PEG-100: diethylene glycol; PEG-400: PEG at M. W. ; PEG-1000: PEG at M. W. .

