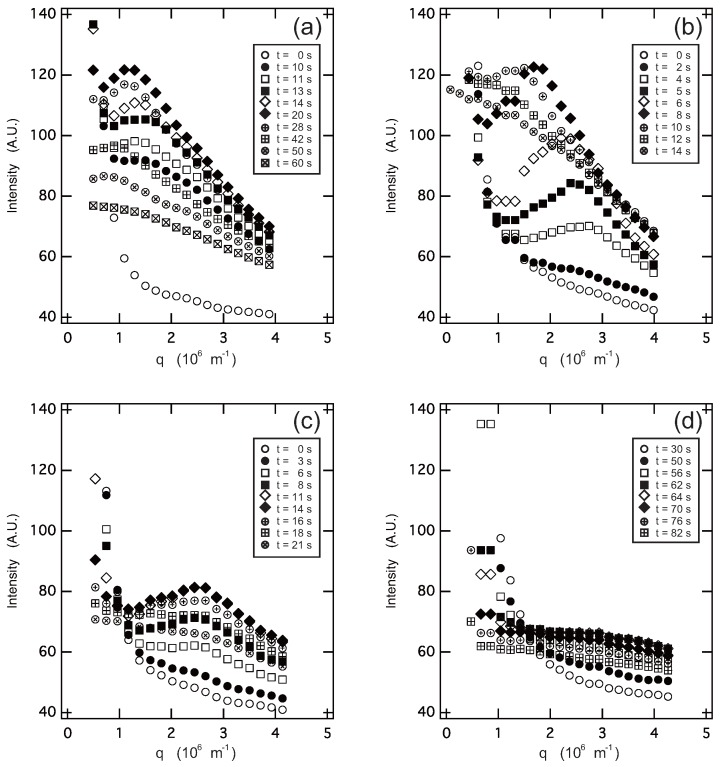
Figure 4.
The light-scattering profile from the system undergoing phase transition. The relative intensity of the scattered light from the sample is plotted as a function of the scattering vector, q. The series of the scattering profiles is plotted as a function of the elapsed time after the temperature change, which is given in each figure. The systems are (T; 40.0 → 10.0 C) (a); (T; 38.0 → 15.0 C) (b); (T; 60.0 → 15.0 C, single quench) (c); and (T; 30.0 → 15.0 C) (second quench of the double quench) (d). The weight fraction of PEG-1000 is fixed at 0.1.

