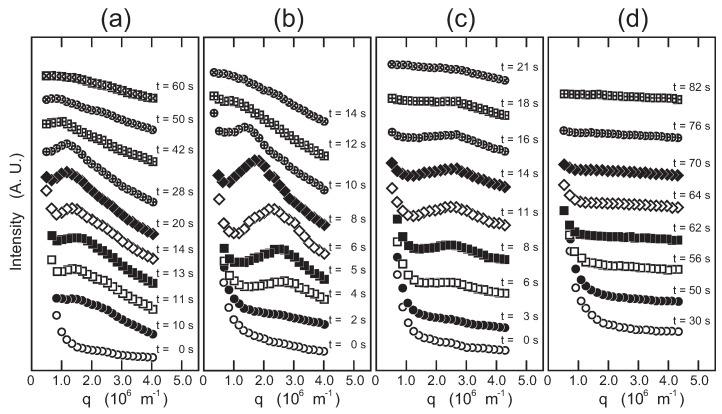
Figure 5.
The scattering profiles shown in Figure 4 are vertically shifted with respect to each other to show the time evolution of the maximum that appeared in the scattering profile. Symbols are the same as used in Figure 4. The systems are (T; 40.0 → 10.0 C) (a); (T; 38.0 → 15.0 C) (b); (T; 60.0 → 15.0 C, single quench) (c); and (T; 30.0 → 15.0 C) (second quench of the double quench) (d). The weight fraction of PEG-1000 is fixed at 0.1.

