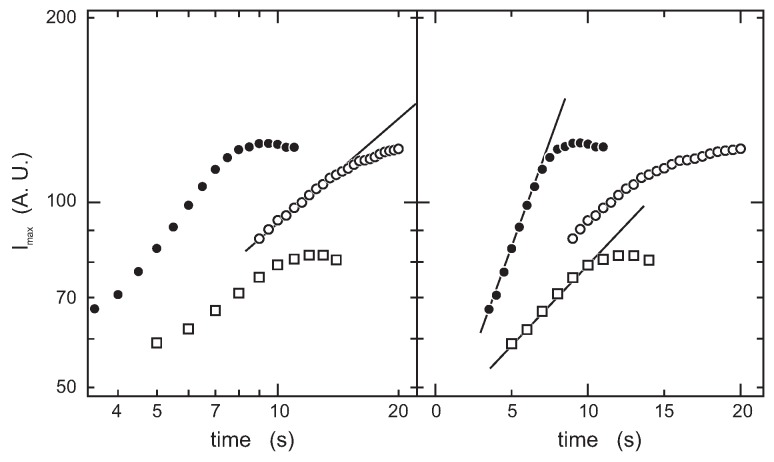
Figure 8.
The time evolution of . Results are shown for the system (open circles), the system (closed circles) and the system with single quench (open squares). The left figure is the double logarithmic plot of the results. The right figure represents the semi-logarithmic plot of the intensity results. The weight fraction of PEG-1000 is fixed at 0.1. The slope of the line drawn for the system in the left figure is about 1.3.

