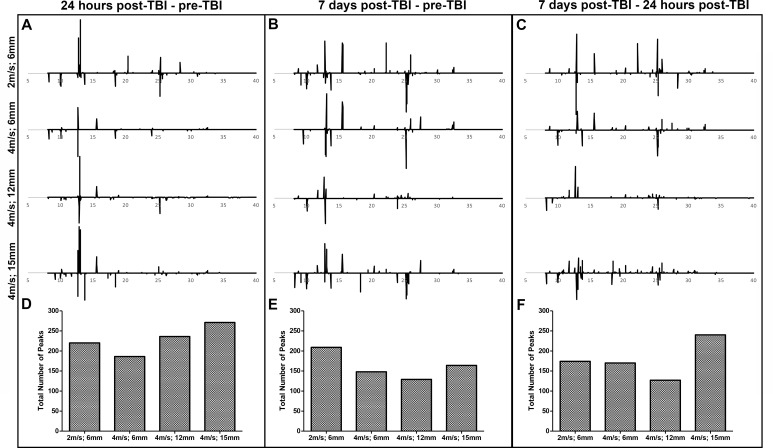
Fig 4. Serum demonstrates dynamic changes in metabolomic profile in all TBI severities and over time.
T-test filtered difference chromatograms (p ≤ 0.05) illustrating the metabolomic differences 24 hours post-TBI compared to pre-TBI (A), 7 days post-TBI compared to pre-TBI (B), and 7 days post-TBI compared to 24 hours post-TBI (C). Y-axis values were held constant to aid in the visualization of relative changes in metabolite concentrations across groups. For A and B, peaks above baseline correspond to metabolites that were significantly increased following TBI compared to pre-TBI, and peaks below baseline correspond to metabolites that were significantly decreased following TBI compared to pre-TBI. For C, peaks above baseline correspond to metabolites that were significantly increased 7 days post-TBI compared to 24 hours post-TBI, and peaks below baseline correspond to metabolites that were significantly decreased 7 days post-TBI compared to 24 hours post-TBI (A-C). After peak deconvolution and alignment of each individual animal, the total number of peaks, or spectral features, above/below baseline were calculated for each TBI group within the 24 hours post-TBI vs. pre-TBI (D), 7 days post-TBI vs. pre-TBI (E), and 7 days post-TBI vs. 24 hours post-TBI (F) comparisons.

