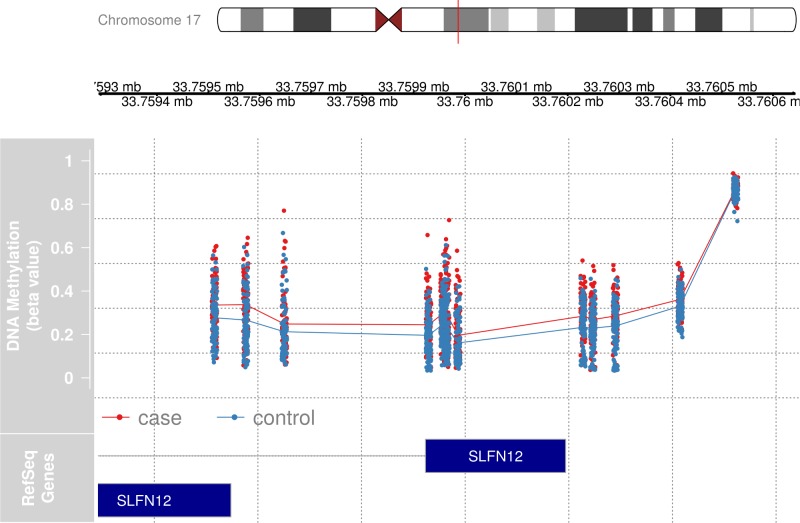
Fig 2. Detailed view of the differentially methylated region on chromosome 17, overlapping the first exon of SLFN12.
Individual CpG sites and sample values from CD4+ cells from 94 cases and 94 healthy controls are represented by dots (red dots–cases, blue dots–controls), whereas the lines represent the average values on each CpG site. The position of two SLFN12 gene transcripts are shown in dark blue. Illustration: the gviz package for R.

