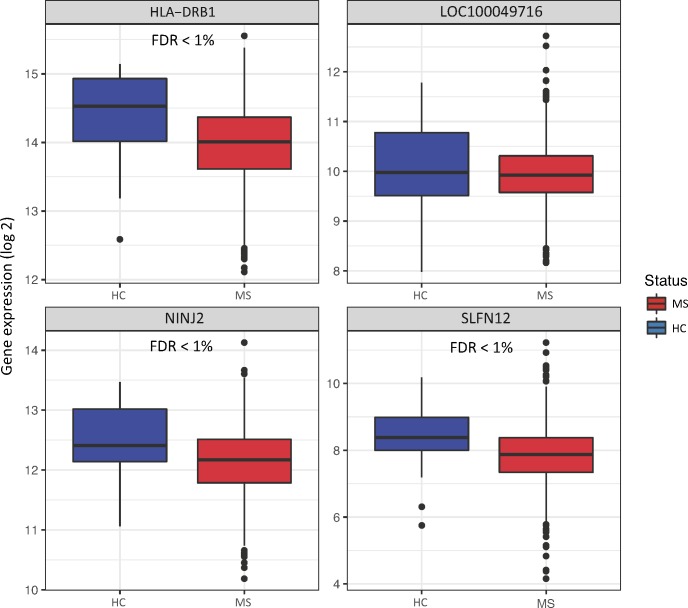
Fig 3. Gene expression levels of HLA-DRB1, LOC100049716, NINJ2, and SLFN12 in whole blood of MS cases compared to healthy controls (HC).
Horizontal lines of boxplots indicate the lower quartile, median, and upper quartile of log2 gene expression intensities; whiskers indicate the lowest and highest values within 1.5 times the inter-quartile range of the lower and upper quartiles; dots indicate outliers.

