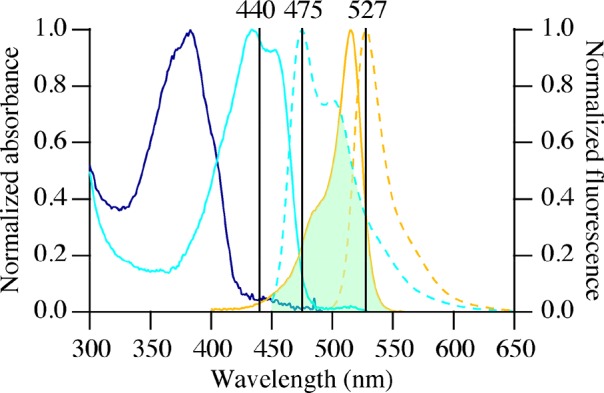
Figure 1.

Normalized absorption spectra of SBFP2 (blue line), mTurquoise2 (cyan solid line), and SYFP2 (orange solid line) and fluorescence emission spectra of mTurquoise2 (cyan dashed line) and SYFP2 (orange dashed line). The listed wavelengths at the top of the graph indicate the following from left to right: excitation wavelength of mTurquoise2 (donor excitation), emission wavelength of mTurquoise2 (donor channel), and emission wavelength of SYFP2 (acceptor channel). The green area indicates the spectral overlap between mTurquoise2 and SYFP2.
