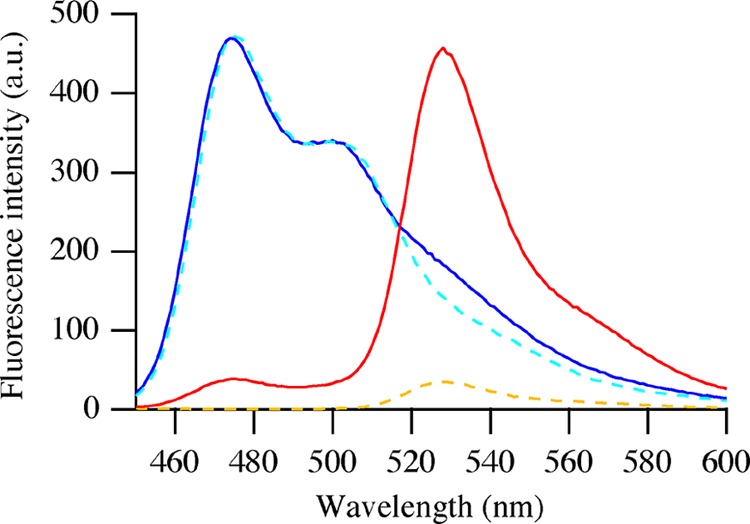
Figure 2.

Steady-state fluorescence emission spectra of mixed C3Ms containing mTurquoise2 and SYFP2 (red solid line), of mixed mTurquoise2 and SYFP2 free in solution (blue solid line), of mTurquoise2 in C3Ms (cyan dashed line), and of SYFP2 in C3Ms (orange dashed line). Proteins are at equimolar concentrations with a total concentration of 1 μM, and excitation was at 440 nm.
