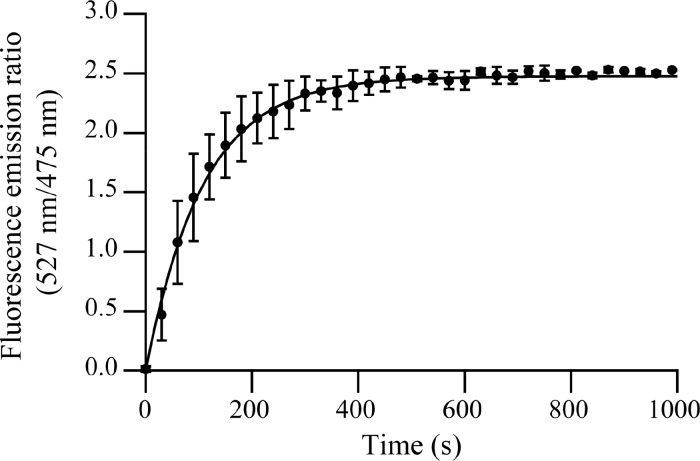
Figure 4.
Fluorescence emission ratio of SYFP2 to mTurquoise2 (527 nm/475 nm, RFRET) as a function of time following the mixing of solutions of polymer and proteins (final concentrations: 0.25 μM mTurquoise2, 0.25 μM SYFP2, 0.50 μM SBFP2, and 0.18 μM P2MVP128-b-PEO477). The solid line is the curve obtained using eq 9, with RFRET,eq = 2.47 and k = 9 × 10⁻³ s–1. Error bars represent the spread of the data (nexp = 2).

