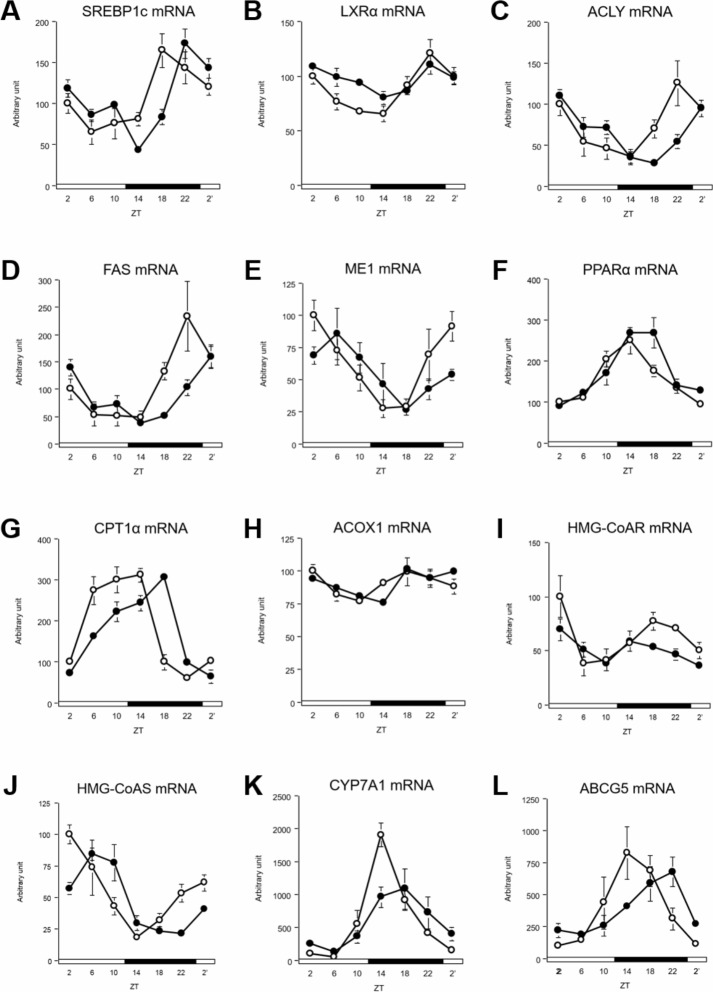
Fig 4. DFAM delayed circadian oscillation of lipid metabolism related genes in liver.
We profiled circadian oscillations of lipid metabolism related genes in liver. We measure mRNA expression oscillations of (A) SREBP1c, (B) LXRα, (C) ACLY, (D) FAS, and (E) ME1 genes related with fatty acid synthesis, (F) PPARα, (G) CPT1α and (H) ACOX1 genes related with fatty acid degradation and (I) HMG-CoAR, (J) HMG-CoAS, (K) CYP7A1 and (L) ABCG5 genes related cholesterol metabolism. The mRNA expressions of hepatic lipid metabolism related genes were analyzed using real-time PCR and those were normalized by Apo E gene expression levels. The open circle indicates control group (○) and the closed circle indicates DFAM group (●). Each value in ZT point is means ± SEM of 4 rats. The open and closed horizontal bars indicate the light (ZT 0–12) and dark (ZT 12–24), respectively. The rhythmicity of hepatic lipid metabolism related gene expression was analyzed by JTK_CYCLE and the results were provided in S5 Table. The statistical significance of differences was analyzed by two-way ANOVA. The results of two-way ANOVA were described in S7 Table.

