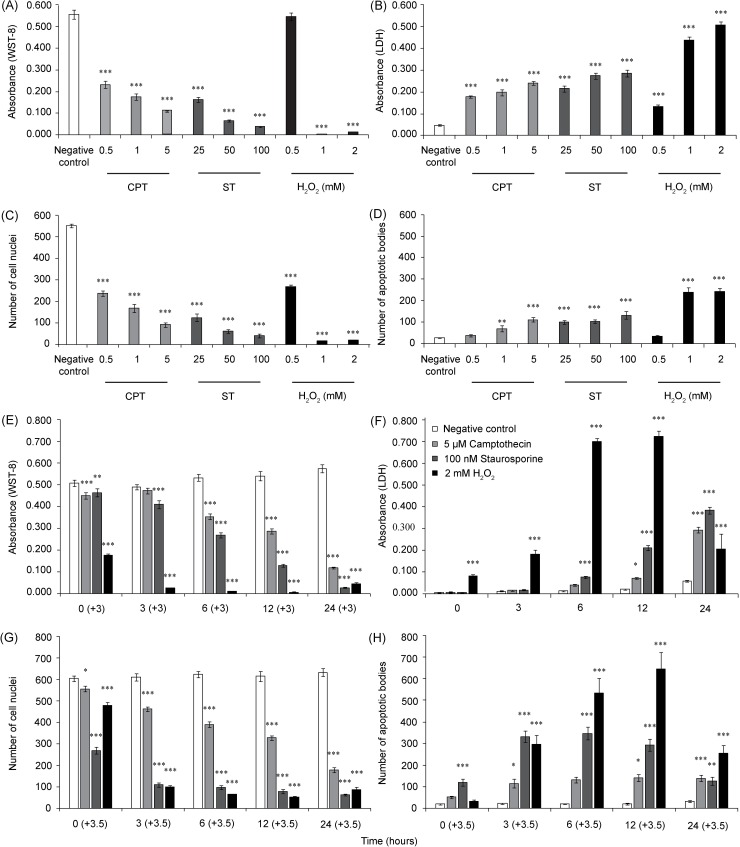
Fig 3. Evaluation of CDS assay performance.
The HUVECs in the 96-well plate were treated with different concentrations of camptothecin, staurosporine or H2O2 for 24 hours (A–D), or with 5 μM camptothecin, 100 nM staurosporine or 2 mM H2O2 for 0, 3, 6, 12 and 24 hours (E–H). Cell viability was measured by WST-8 assay (A, E), and cell necrosis was evaluated by LDH assay (B, F). A count of the intact cell nuclei (C, G) and apoptotic bodies (D, H) was evaluated by ImageJ software after the cells were stained with Hoechst 33342. The WST-8 data and number of cell nuclei and apoptotic bodies were processed with 3h and 3.5h time difference, respectively. The data represent three independent experiments performed in 6-plicates. The bar graphs show the means ± SEM. Repeated measures were statistically tested by one-way ANOVA followed by Dunnett’s post-test. ***P<0.001, **P<0.01, and *P<0.05, versus the negative control.

