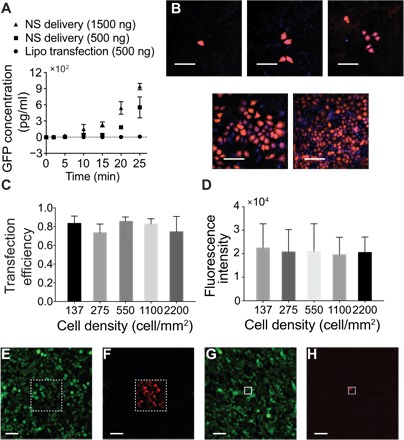
Fig. 4. Characteristics of NES delivery.

(A) mRNA expression kinetics for NES and LFN delivery. Expression is observed at 5 min for NES, indicating rapid cytosolic availability [error bars indicate SD (n = 3)]. (B) Fluorescent microscopic images show normal HEK 293 cell morphology after mRNA transfection for different cell densities (scale bars, 200 μm). (C) Transfection efficiencies for different cell culture densities were more than 75% in all cases, and no statistical significance was observed, showing that the method is consistent even for very different cell densities [error bars indicate SD of experimental replicates; P = 0.65, one-way analysis of variance (ANOVA)]. (D) Averaged mCherry expression intensity for different cell densities showed no statistically significant difference (error bars indicate SD (n = 8 to 53); P = 0.84, one-way ANOVA). (E to H) eGFP-expressing HeLa cells cultured on a patterned NS platform with square active areas of 200 μm by 200 μm [scale bars, 100 μm (E and F)] and 50 μm by 50 μm [scale bars, 100 μm (G and H)]. Only the cells cultured within the active areas with exposed NS expressed an mCherry signal (F and H) after delivery.
