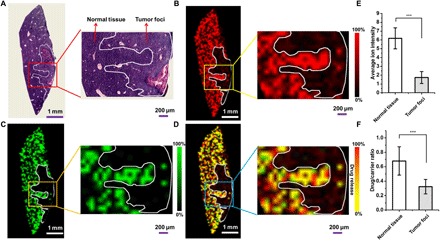
Fig. 4. Images of the distribution of MoS2 nanosheets and their payload anticancer drug DOX in the liver tissue of orthotopic H22 tumor model mice after 24-hour intravenous injection.

(A) H&E-stained image of the tumor-bearing liver tissue. The inset is the zoomed-in area of interest showing the normal tissue and tumor foci. (B and C) Corresponding LDI MSI images of DOX/PEG-MoS2 nanosheets at (B) m/z = 193.8 and (C) m/z = 321.0 in tumor-bearing liver tissue. Insets show the detailed distribution information in normal tissue and tumor foci corresponding to the zoomed-in area. (D) Merged LDI MSI images of m/z = 193.8 and m/z = 321.0 in liver tumor-bearing liver tissues. (E) Average ion intensity of DOX/PEG-MoS2 at m/z = 193.8 in normal tissue and tumor foci in (B). (F) Average drug/carrier ratio in normal tissue and tumor foci, which were obtained by calculating the average ion intensity ratio (Im/z 321.0/Im/z 193.8) in 10 randomly selected regions of normal liver tissue and tumor foci (50 pixels each), respectively. ***P < 0.01. The statistical results shown in this figure were obtained from the mice that we showed in this figure, but we have done three different mice in each group, and they all showed similar results.
