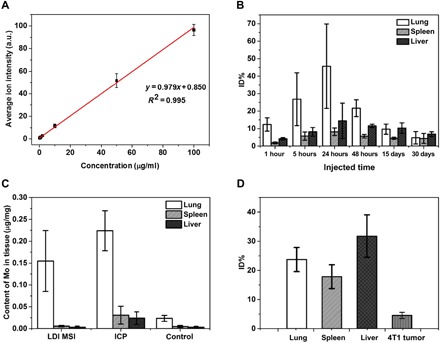
Fig. 5. Quantification of MoS2 nanosheets in organs.

(A) Calibration curve plotted average ion intensities of m/z = 193.8 against concentrations of MoS2 nanosheets in spleen homogenate. (B) Quantification results of bare MoS2 nanosheets in different organs varied with different time courses. (C) Comparative quantification of Mo element in different organs by LDI MS and ICP MS. The control group showed the content of Mo element in normal Kunming mice (three normal mice were tested) detected by ICP MS. (D) Quantification of MoS2 nanosheets in the lung, spleen, and liver and 4T1 tumor of 4T1 tumor model mice bearing 24-hour intravenous injection of DOX/PEG-MoS2.
