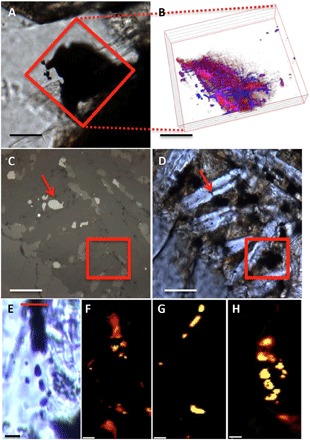
Fig. 1. Light and CRIS of the relationship between magnetite and MMC in the meteorites studied.

(A) Transmitted light microscopy image of a darkened area within maskelynite, entrained in the subsurface to the thin section in NWA 1950 (scale bar, 100 μm). The red box indicates the area for three-dimensional (3D) mapping by CRIS. (B) A 3D depth profile composite CRIS image of magnetite (red) and MMC (blue) (slices are 2 μm apart) from the area denoted by the red box in (A) (scale bar, ~60 μm). (C and D) The same area of Nakhla mesostasis imaged in transmission and reflection showing a magnetite grain beneath the surface of the section (marked by red arrows) (scale bars, 20 μm). (E) Transmitted light image of a magnetite-rich area (dark vertical band) in the Tissint meteorite [scale bar, 20 μm; red line on top delineates the area where a focused ion beam (FIB) section was removed for analyses; see Fig. 4]. (F to H) CRIS imaging maps taken at 8 μm into the surface of the thin section and depth profile of the feature shown in (A); (F) magnetite, (G) pyrite, and (H) MMC.
