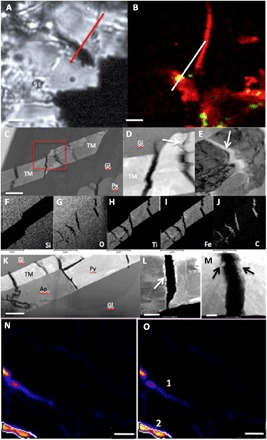
Fig. 3. TEM and hydrogen isotopic analysis of MMC-rich areas in the Tissint meteorite.

(A) Light microscopy image of a TM lath within maskelynite in the Tissint meteorite (dark area across the line denotes the area from which the FIB section was extracted). Scale bar, 3 μm. (B) Composite CRIS map showing TM in red and MMC in green; the white line corresponds to the red FIB line in (A). Scale bar, 3 μm. (C to E) TEM HAADF images of the extracted FIB section shown in (A) and (B), illustrating that the TM lath is cracked along its length. Scale bars, 500 nm (C) and 100 nm (D and E). (D) A closeup image of the red box in (C), showing two of the cracks and evidencing that the edge of the cracks are corroded (white arrow). (E) Cracks filled with MMC as documented in the EDX maps in (F) to (J). (F) Silicon, (G) oxygen, (H) titanium, (I) iron, and (J) carbon. Scale bars, 1 μm (F to J). (K to M) HAADF image of an inclusion assemblage in NWA 1950. The high-resolution images and analyses of the FIB section revealed that TM, and in this case, pyrrhotite and apatite laths are also cracked, and we know from the CRIS mapping shown in Fig. 1B that the magnetite is intimately interlinked in NWA 1950 with MMC. Scale bars, 2 μm (K), 300 nm (L), and 200 nm (M). Crack in pyrrhotite with the edges lined with deposited magnetite nanocrystals (area of high brightness lining the crack marked with a white arrows). (M) Close-up of the TM grains again showing evidence of corrosion along the edges of the cracks in the grains (arrows). (N) C13, nanoSIMS map of a different TM lath in the Tissint meteorite that had previously been confirmed by CRIS to contain MMC. Scale bar, 5 μm. (O) Deuterium map of the same area as in (N); area 1 recorded a δD of 2252 ± 392‰ and area 2 recorded a δD of 4536 ± 1113‰, scale bar, 5 μm.
