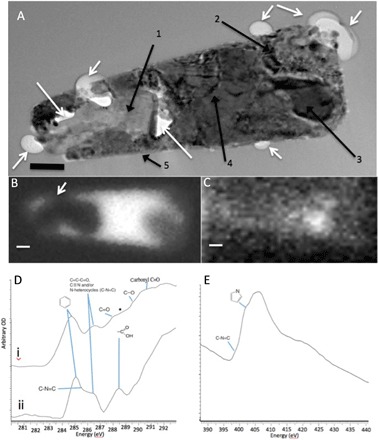
Fig. 4. TEM imaging and soft transmission x-ray analysis of MMC within an inclusion of the Tissint meteorite.

(A) Bright-field TEM image of a FIB section from the Tissint meteorite milled from the area analyzed by CRIS. The image reveals a highly complex inclusion. White arrows indicate bubbles protruding into the surrounding maskelynite matrix or void space inside the inclusion. Black arrows point to specific mineral phases identified by high-resolution imaging and EDX and SAED analyses (figs. S2 and S3) corresponding to (1) anhydrite, (2) magnetite and carbon, (3) Ni-containing pyrrhotite, (4) nanocrystalline multiphase magnetite and calcium-aluminium silicate phases, and (5) rim of sheet silicate–like aluminosilicate, probably montmorillonite (scale bar, 150 nm). (B) STXM map of Fe at 708.62 eV showing the iron-rich area of the inclusion (in white), including the area around the anhydrite grain and the bubble projecting into the glass matrix (arrow). (C) STXM map at the C-K edge at 284.9 eV showing a hot spot of aromatic carbon corresponding to pyrrhotite and magnetite (areas 2 and 3) shown in (A) (lighter shade shows greater concentration). Scale bars, 200 nm. (D) STXM spectrum of two inclusions from Tissint: (i) hot spot area in (C), showing the presence of peaks at 284.9, 286.4, and 288.56 eV, with a star demarking a possible shoulder peak at 288.56 eV; (ii) peaks from another inclusion containing many of the same functional groups as in (i) but also a shoulder at 285.6 eV, which is possibly indicative of 400 eV and pyrrole functionality at 405 eV. (E) STXM N-K edge spectrum from the same inclusion as spectrum (i) in (D), confirming the presence of C–N=C functionality at 400 eV and a pyrrole group at 405 eV. OD, optical density.
