
Fig. 3. Calibrated radiocarbon ranges for each site in our database (x axis) and the probability of each of these sites being in the niche during that same phase of occupation (y axis).
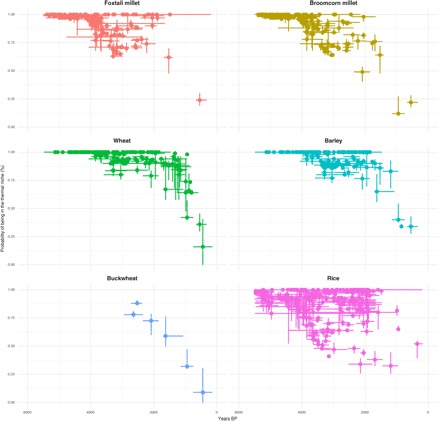
An interactive version of this figure that labels each of the cross-plots and enables zooming is available as data file S2.