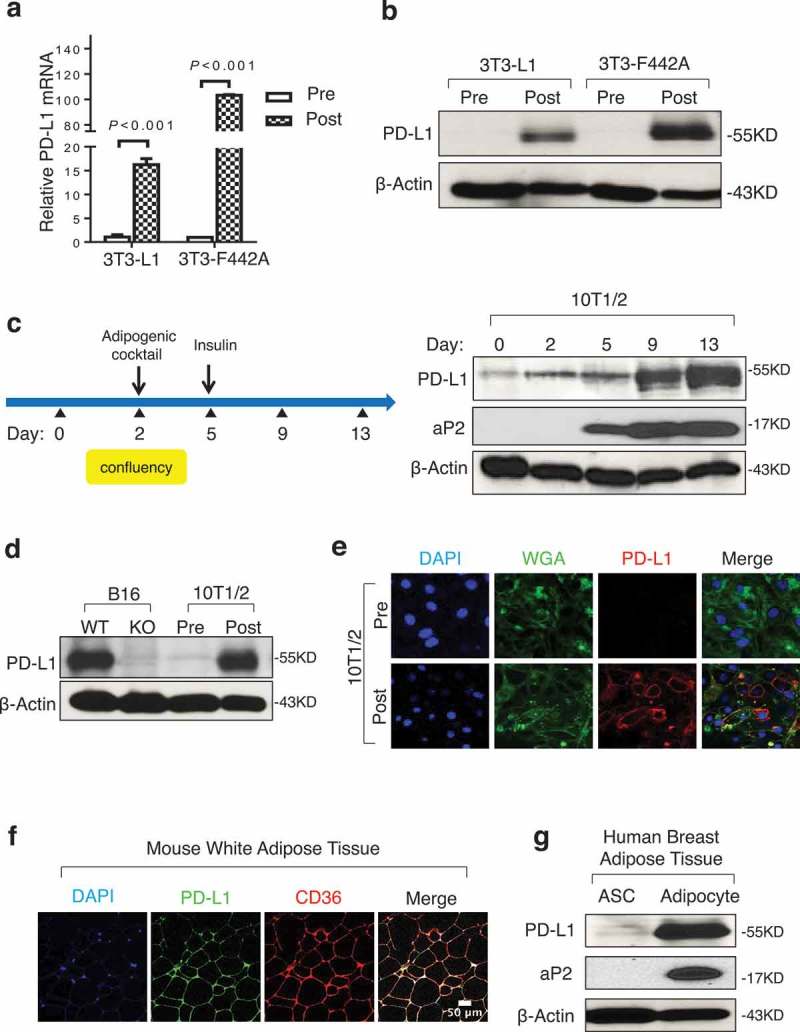
Figure 1.

Adipocytes express high levels of PD-L1. (a) PD-L1 mRNA by PCR in 3T3-L1 and 3T3-F442A pre- and post-adipogenesis. (b) PD-L1 protein in cells by WB before and after adipogenesis. (c) Diagram for in vitro adipogenesis (left) and PD-L1 protein expression at different stages of adipogenesis in 10T1/2 (right). aP2 is an adipogenic marker and β-actin is the loading control. (d) Comparison of PD-L1 protein by WB in 10T1/2 pre/post adipogensis and PD-L1 WT/KO B16 melanoma cells. (e) Representative immunofluorescence images of PD-L1 (red), plasma membrane marker wheat germ agglutinin (WGA, green) and nuclear marker DAPI (blue) in pre- and post-adipogenic 10T1/2 cells. (f) Immunostaining of PD-L1 and CD36 using WAT from C57BL/6 mice. (g) WB of PD-L1 and aP2 proteins in adipose stromal cells (ASC) and adipocytes from human breast tissue. One representative result from three donor samples are shown here. β-Actin is used as the loading control. Values represent mean ± SD.
