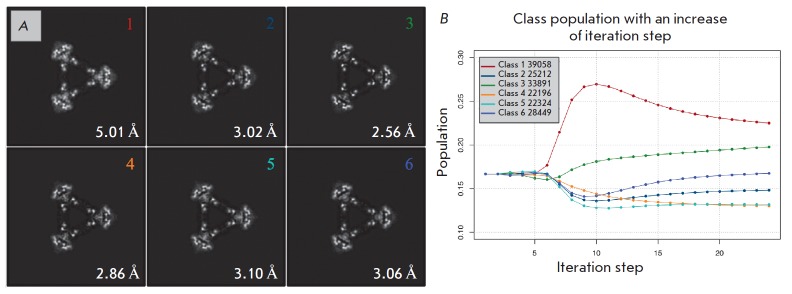
Fig. 5.
Results of 3D classification. A – central sections of the classes. Images from 1 to 44 (blue) were used for further analysis and density map reconstruction. Images from 45 to 50 (red) were excluded from further data processing, B – changes in the class populations depending on the step of iteration. Dots are colored in accordance with a numbering color on the A panel

