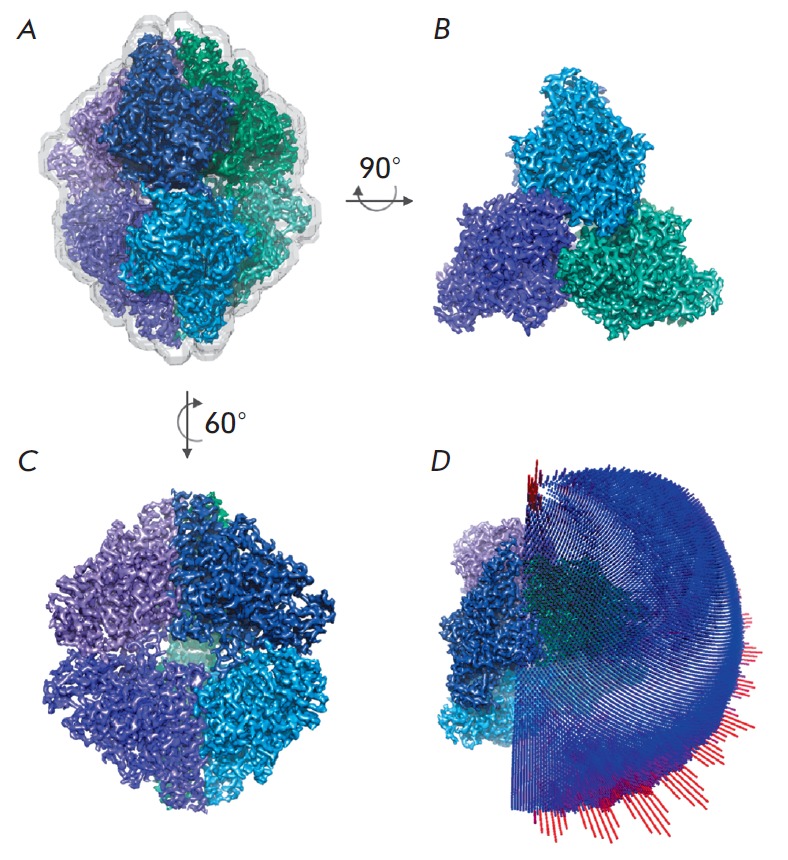
Fig. 6.

Final density map with the best resolution of 2.56 Å. A – the mask used for reconstruction and resolution assessment is shown by a gray semi-transparent isosurface; B–C – density maps in different projections, individual subunits of the protein hexamer are highlighted in colors; D – distribution of projections for the angle classification used
