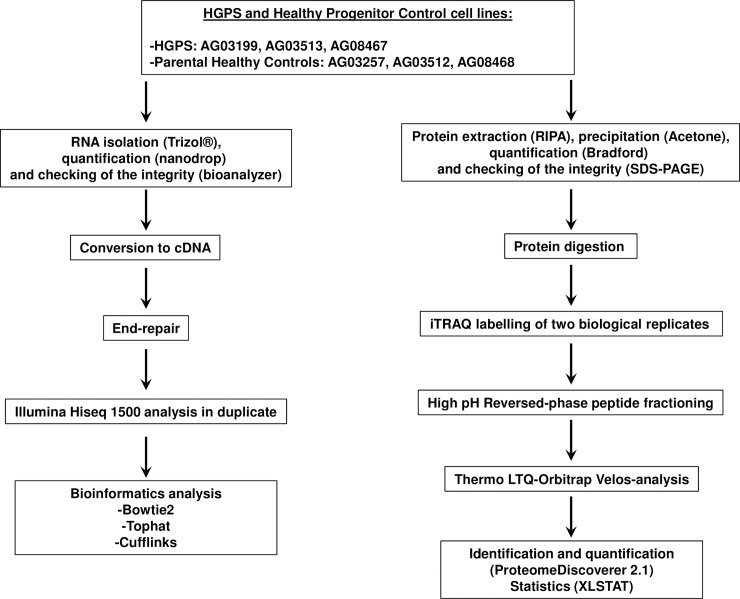
Fig 1. Parallel genomic and proteomic workflows.
Schematic representation of the workflow followed for the genomic (left) and proteomic (right) large-scale approaches. HGPS and Healthy Progenitor cell lines were processed for RNA and total protein isolation. RNA was converted to cDNA for analysis in a Illumina Hi seq 1500 platform. Two technical replicates were analyzed for each sample. Raw data was processed and statistical analysis was done using Bowtie2, TopHat and Cufflinks programs. Total protein extracts were labeled using iTRAQ 8-plex. Two biological replicates were processed in parallel (iTRAQ1 and iTRAQ2). Labelled peptides were fractionated by Basic Reversed-phase chromatography and fractions were analyzed in a LTQ-Orbitrap Velos platform. Protein quantification was done using Proteome Discoverer 2.1 software and XLSTAT software was used for statistical analysis.

