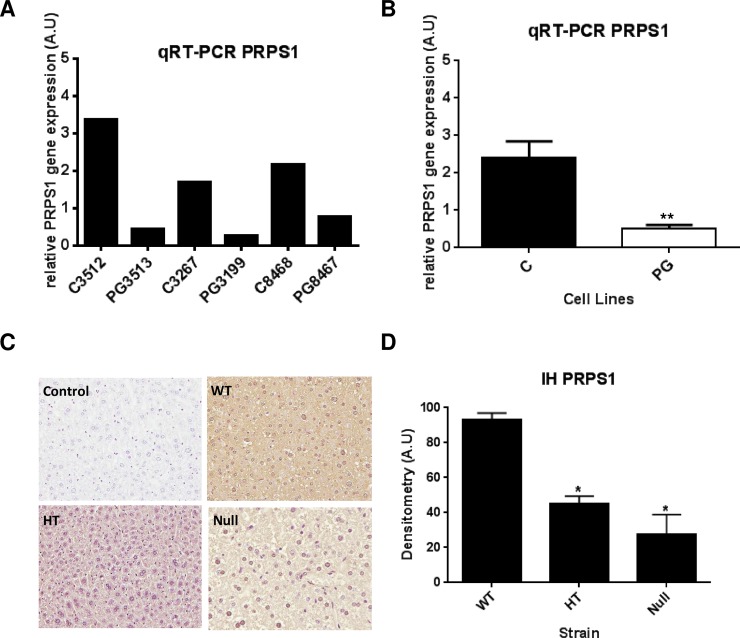
Fig 4. Targeted validation of PRPS1 shows down-regulation of transcript and protein levels in HGPS-cells and the animal model of HPGS, respectively.
Orthogonal validation of PRPS1 modulation by targeted techniques in cell lines (A, B) and in the mouse model of HGPS (C, D). Real-Time PCR (RT-PCR) of HGPS and control cell lines (A) showing that PRPS1 transcript is down-regulated in the three HGPS cell lines when compare to their respective controls. Statistical analysis (B) demonstrates that the difference between control and HGPS is significant (p-value ≤ 0.01). Representative images (C) of the immunohystochemistry of the PRPS1 protein in liver sections of the ZMPSTE24-null mice strain (magnification: 20x). Statistical analysis shows that wild-type mice (WT) present significant (p-value ≤ 0.05) higher levels of the protein than heterozygous and null mice.

