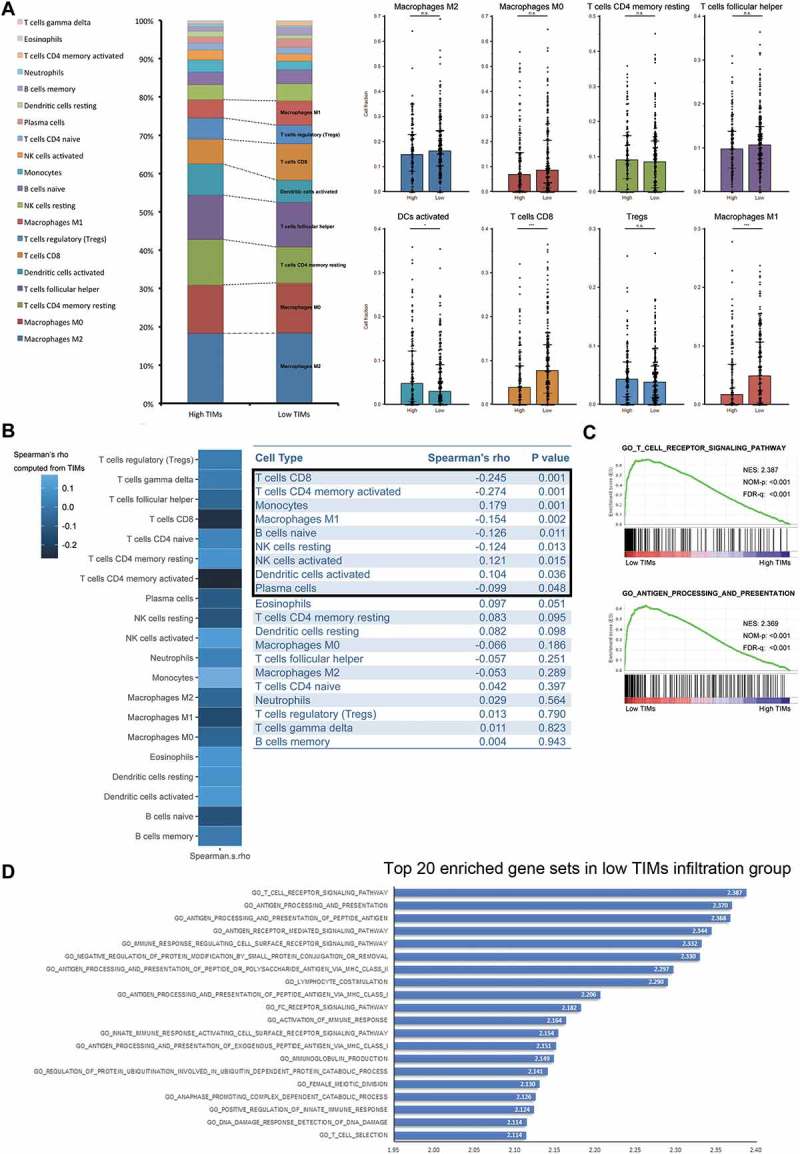
Figure 3.

Differences of immune cell infiltration and biological process pathways according to TIMs infiltration in MIBC. (A) Frequency of immune lineages based on TIMs infiltration (left). Barplots (right) showed major abundant immune cells distribution according to TIMs. (*p < 0.05, **p < 0.01, and ***p < 0.001 by Mann-Whitney U test). Barplots show median ± quartile. (B) Heatmap showed Spearman’s correlation coefficients computed from analyses among different cell types and TIMs (left). Charts (right) listed detailed Spearman’s rho and corresponding P values. (C) Top two enriched biology pathways related with immune response in low TIMs infiltration groups. Gene Otology Biological Process gene sets from MSigDB were used. 1000 random sample permutations were performed. NES: Normalized Enrichment Score; NOM-p: Nominal P Value; FDR-q: False discovery rate. (D) Top 20 enriched gene sets in low TIMs group derived from GSEA. Gene Otology Biological Process gene sets from MSigDB were used. 1000 random sample permutations were performed.
