Figure 4.

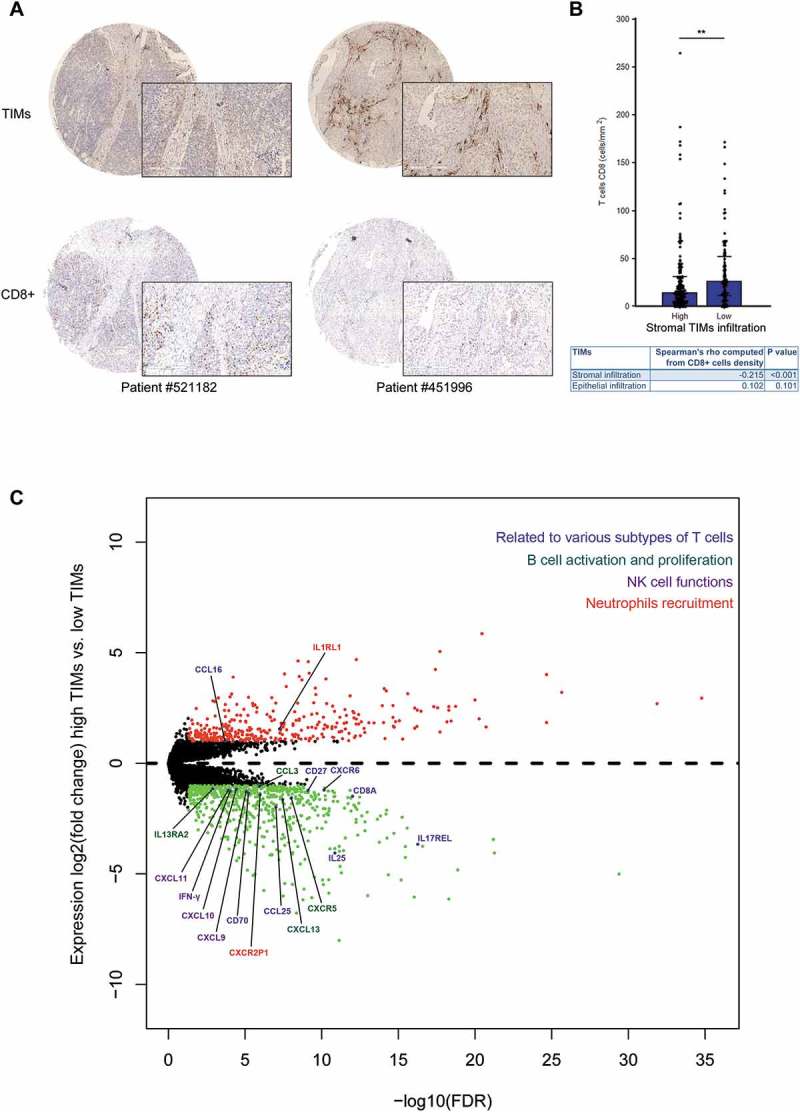
CD8 + T cells were correlated with TIMs infiltration in MIBC. (A) Representative immunohistochemistry images of high (left bottom) and low (right bottom) CD8+ cells infiltration in corresponding low (left upper) and high stromal (right upper) TIMs infiltration patients. Original, 48X; magnification, 200X. (B) Barplots showed frequencies of CD8+ cells density according to stromal TIMs infiltration. (*p < 0.05, **p < 0.01, and ***p < 0.001 by Mann-Whitney U test.). Barplots show median ± quartile. Chart (bottom) listed detailed Spearman’s rho and corresponding P values computed from correlation analyses among CD8+ cell density and stromal or epithelial TIMs density subgroups. (C) Volcano plot presented differential gene expression involved in multiple immune cells reaction between high and low TIMs groups. Gene in red or green were significantly differential expressed (defined as FDR-adjusted p-value ≤ 0.05 and fold change of at least 2x).
