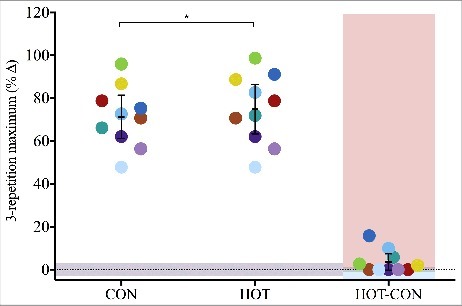
Figure 4.

Mean (±95% CI) and individual (n = 10) percent change in knee extensor 3-repetition maximum (3RM) strength of control (CON) and heated (HOT) limbs when measured after 12-week resistance training; participants' between-condition (HOT-CON) differences are highlighted with red and blue shaded areas indicating greater HOT and CON response, respectively; grey shaded areas indicate zone of trivial effect; *significantly different (p < 0.05) from baseline.
