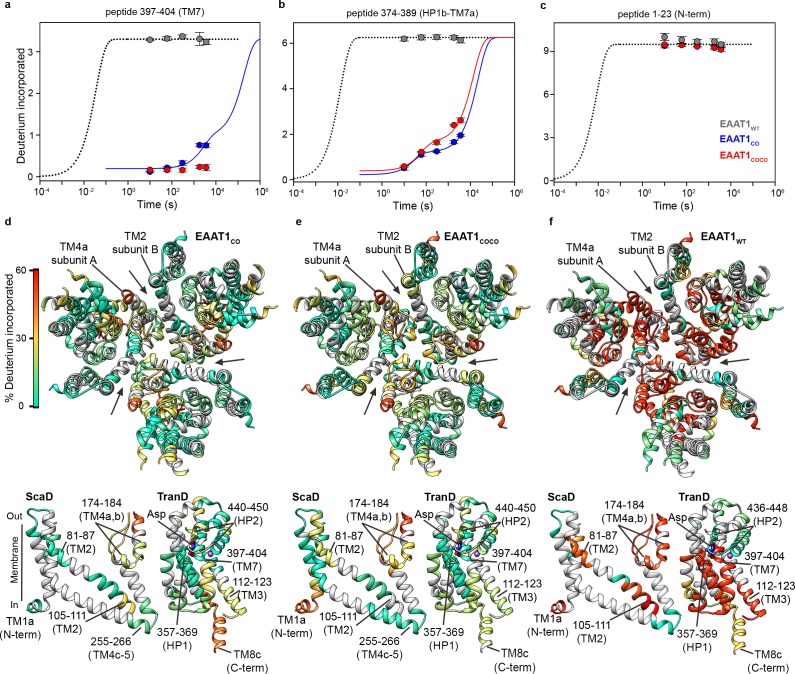
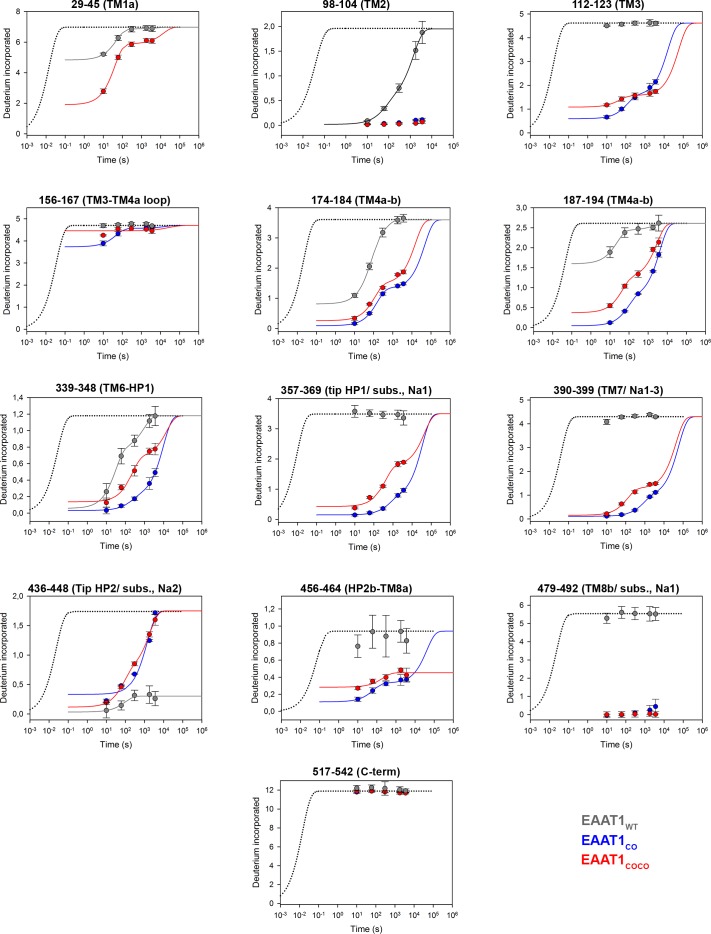
Figure 2. | Deuterium exchange at 20°C.
(a-c) Deuterium uptake kinetics at 20°C of examples peptides from EAAT1WT (grey), EAAT1CO (blue), and EAAT1COCO (red), respectively, covering both helical and unstructured regions of the transporters. Solid lines represent double-exponential fits to the data, and dotted lines the expected deuterium kinetics of unfolded and solvent exposed peptides (see ‘HDX kinetic analysis’ in Methods). Plots in (a–c) depict an average of three independent experiments, and error bars represent s.e.m. (d-f) Deuterium incorporation after 1 hr at 20°C in EAAT1CO (d), EAAT1COCO (e), and EAAT1WT (f) mapped into the structure of the EAAT1CRYTS (PDB 5LLM) trimer viewed from the extracellular medium (upper panel), as well as the scaffold (ScaD) and the transport (TranD) domains viewed from the membrane (lower panel), respectively. These domains are depicted separately for clarity of display, and black lines indicate the approximate position of some peptides in the structure, and the substrate (Asp). In the trimeric depiction, arrows point to the interface between protomers. Deuterium incorporation was calculated as an average of three independent experiments, and normalized to the maximal theoretical incorporation based on the number of backbone amide available for exchange in each peptide. The color code representing deuterium incorporation is depicted in a scale bar (d).

