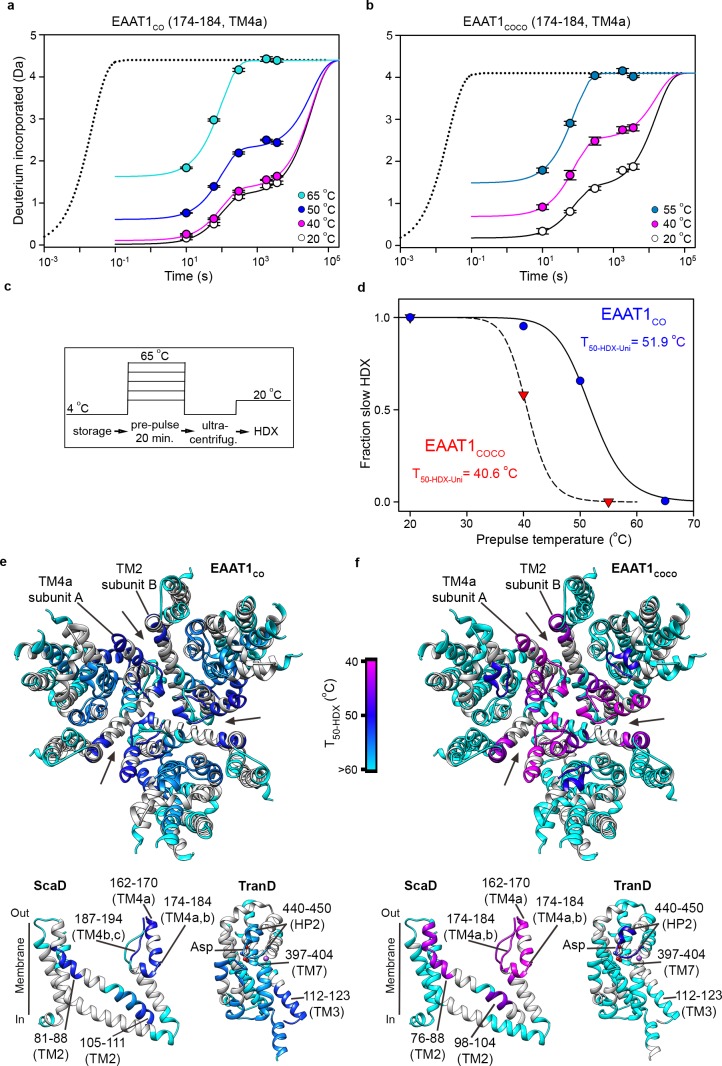
Figure 6. | Local thermal unfolding.
(a-b) Deuterium uptake kinetics at different pre-pulse temperatures of example peptides containing residues 174–184 in EAAT1CO (a), and EAAT1COCO (b), respectively. Solid lines represent double-exponential fits to the data, and dotted lines the expected deuterium kinetics of the unfolded and solvent exposed peptide at 20°C (see methods). Plots in (a–b) depict an average of three independent experiments, and error bars represent s.e.m. (c), Depiction of the temperature protocol used to prepare the protein samples. (d), The fraction of the slow HDX component extracted from the double-exponential fit to the kinetic data in (a) and (b) corresponding to EAAT1CO (blue symbols) and EAAT1COCO (red symbols), respectively. Lines represent the fit of a Hill-like equation with T50-HDX-Uni values 51.9°C and 40.6°C in EAAT1CO and EAAT1COCO, respectively, and H values of −18.7 and −20, respectively. (e–f) T50-HDX-Uni values, calculated as in (d), of EAAT1CO (e) and EAAT1COCO (f), respectively, are mapped into the structure of the EAAT1CRYST (PDB 5LLM) trimer viewed from the extracellular medium (upper panel), as well as the scaffold (ScaD) and the transport (TranD) domains viewed from the membrane (lower panel), respectively. These domains are depicted separately for clarity of display. The color code representing T50-HDX-Uni values is depicted in a scale bar between the trimers. Peptides that did not show any temperature-induced HDX changes are also labeled in cyan (T50-HDX-Uni>60°C).


