
Figure 3.
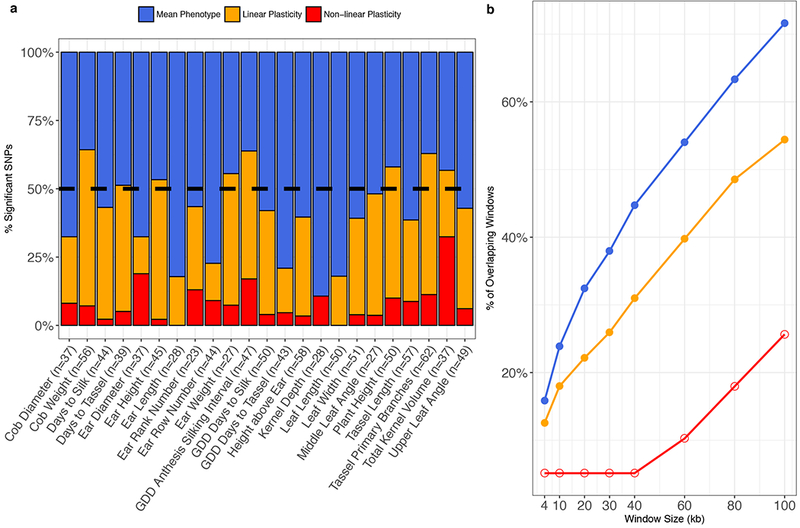
a. Relative proportions of SNPs associated with mean phenotype values and linear and non-linear plasticities for 23 phenotypes. The percentage of plasticity-associated SNPs is greater than 50% (dashed black line) for 11/23 phenotypes. b. Percentage of overlapping windows centered on associated SNPs for mean phenotype values and linear and non-linear plasticities with windows centered on SNPs from Wallace et al.34. Closed circles denote windows for which more overlaps were observed than expected by chance (two-sided permutation test) at the α = 0.05 level; open circles denote windows that do not differ significantly from the null hypothesis.