
Figure 4.
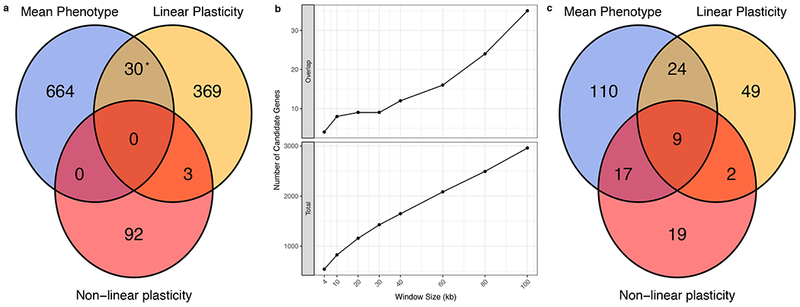
a. Number of candidate genes (n = 1,158) identified for mean phenotype values and a plasticity measure. Asterisks indicate enrichment at the α = 0.05 level (two-sided Fisher’s exact test). b. Number of overlapping candidate genes and total candidate genes at different window sizes. Total genes are those falling within a window of the given size centered on each significant SNP. Overlapping genes are those candidate genes that fall within a window for a mean phenotype value and a window for a plasticity measure of the same phenotype. c. Number of GO terms (n = 230) enriched for pools of candidate genes at a 1% FDR threshold (two-sided hypergeometric test).