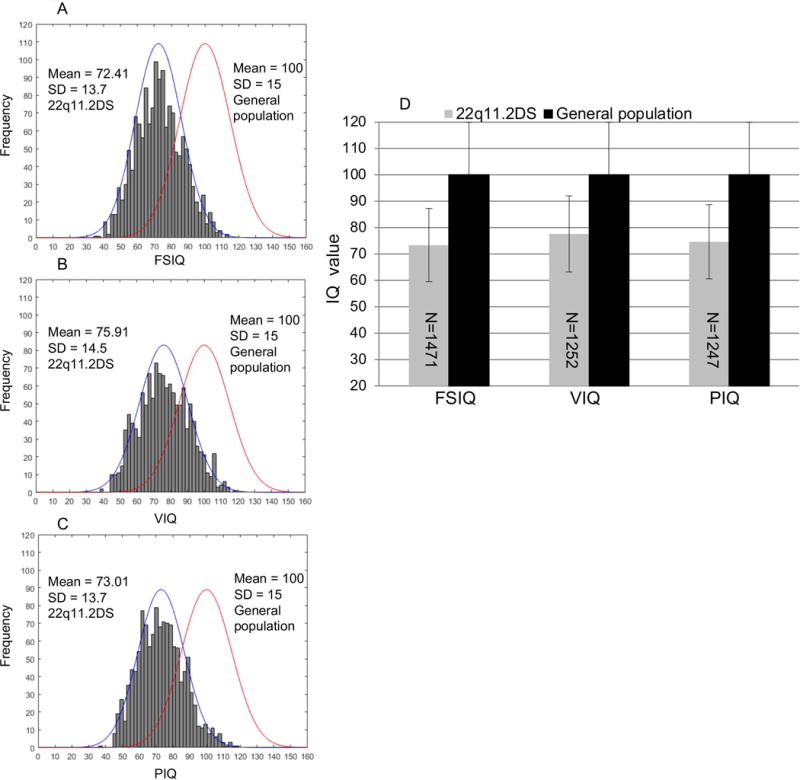
Fig. 1. Distribution of full scale IQ, verbal IQ and performance IQ among subjects with 22q11.2DS.

(A-C) Frequency distribution of Full scale IQ (FSIQ, 72.41 ±13.7), verbal IQ (VIQ, 75.91±14.5) and performance IQ (PIQ, 73.01±13.7) among the 22q11.2DS population and fitted normal curves to the right, respectively. The normal curves to the left denote the IQ distribution in general population (100 ±15). Distribution of IQ are shifted to the left as compared to those in general population by almost 2 SDs. (D) Differences of mean IQ scores were determined by independent samples t-test. ** P <0.01. Numbers in the bars denote the samples with FSIQ, VIQ and PIQ, available, respectively. FSIQ, VIQ and PIQ were all significantly lower than those of general population.
