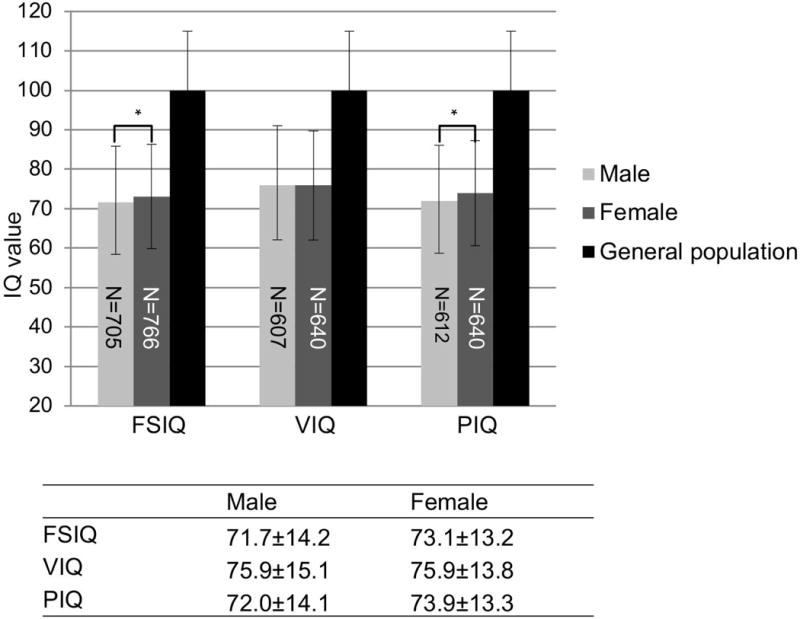
Fig. 2. IQ distribution between males and females within the 22q11.2DS population.

IQ values are expressed as mean±SD. An independent-samples t-test was conducted to compare the mean IQ scores in male versus female subjects. Significant differences are denoted by an asterisk in bar plots with P < 0.05. Numbers in the bars denote samples size of each category.
